Pocketfolio Team
September 25, 2026

Learning how to track crypto funding rates across multiple exchanges sounds like a data problem. It is really a comparison problem.
Pulling the numbers is easy. Every major venue publishes them, most of them for free.
Making those numbers mean the same thing as each other is the hard part, and it is where most traders quietly go wrong.
Two venues can show what looks like the same rate on the same coin, and one of them can be paying eight times what the other does. Nothing on either page tells you that.
This guide covers the three ways people track rates, what each one costs you in time and accuracy, and the conversion step that decides whether your comparison means anything at all.
There are three practical methods, and they suit very different people.
Manual tracking means opening each exchange’s funding page yourself. It costs nothing, it takes minutes per round, and it stops working the moment you follow more than a handful of pairs.
A spreadsheet fed by exchange APIs automates the collection. It is free to run, it takes real effort to build, and it breaks whenever a venue changes its API.
A dedicated crypto funding rate arbitrage scanner does both the collection and the normalisation for you. It costs money or an account, and it removes the part of the job that scales worst.
Most traders start on the first, move to the second, and end up on the third. The section below on normalisation explains why that path is so common.
A single venue tells you what that venue pays. It says nothing about whether that is good.
Funding rates are set by each exchange’s own order book, so the same coin can pay noticeably differently in two places at the same moment. Without a second reference point you cannot tell a strong rate from an ordinary one.
There is a second reason, and it matters more for crypto funding rate arbitrage specifically.
The strategy needs a spread, not a rate. You are comparing what one venue pays against what another charges, so a one-venue view is structurally unable to show you the trade.
A third reason is timing. Venues settle on different schedules, so a rate that looks attractive on one exchange may already have been paid out before you can act on it elsewhere.
None of that is visible from inside a single account.
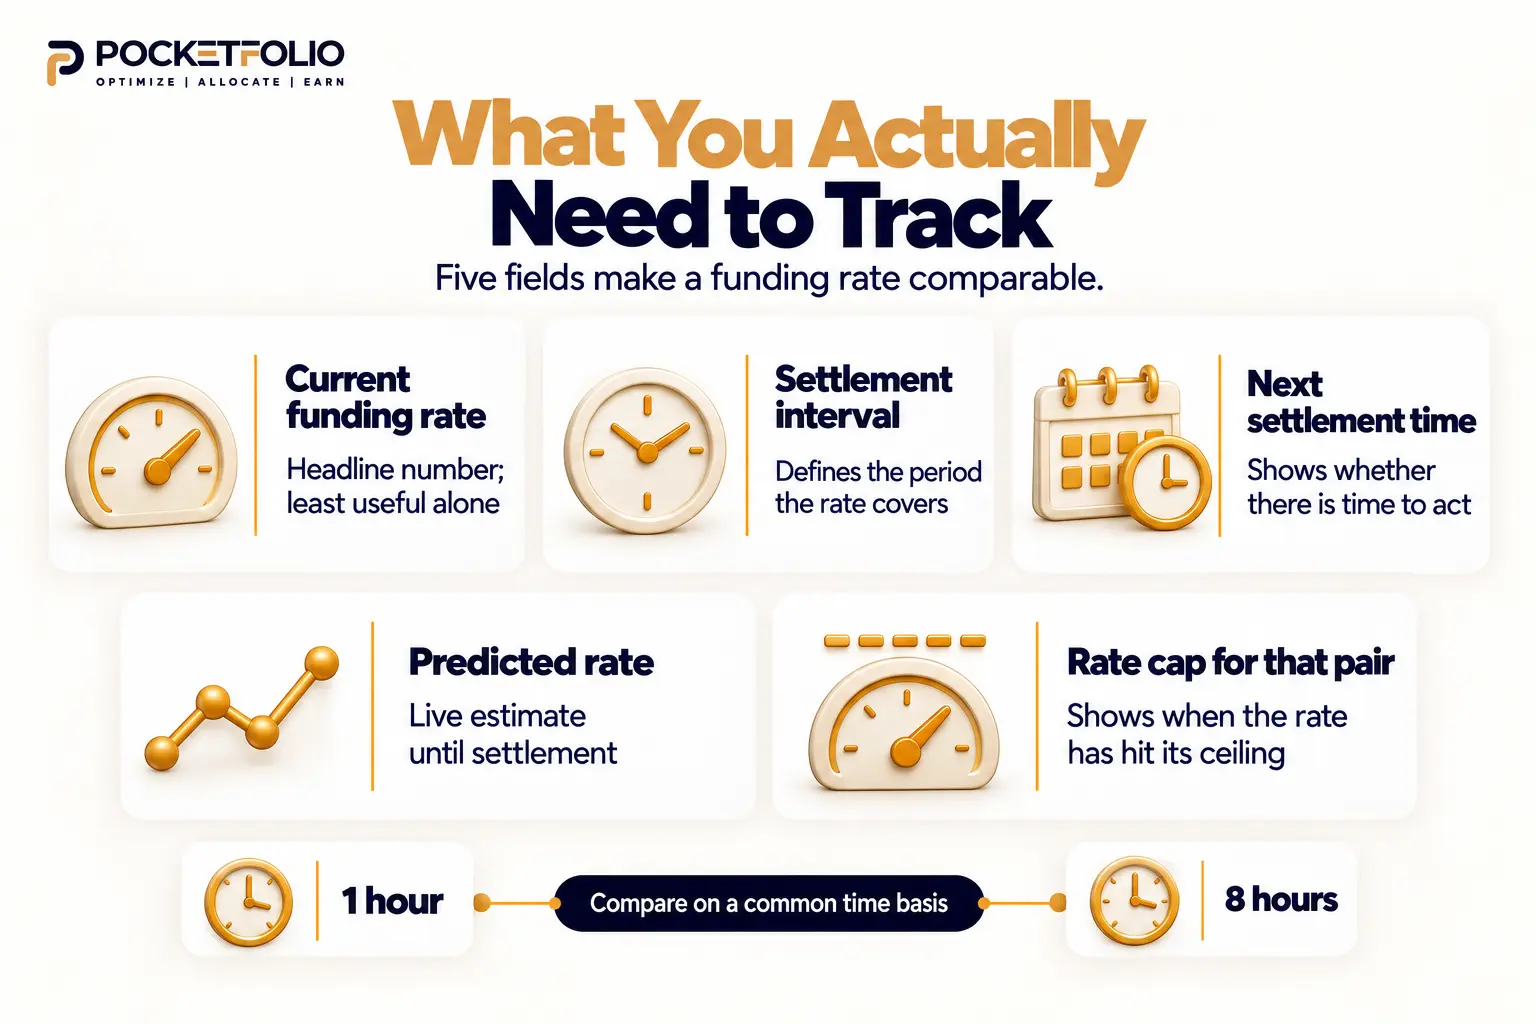
Most people track the rate and stop. That is the single biggest cause of comparisons that look right and are not.
| Field | Why it matters |
|---|---|
| Current funding rate | The headline number, and the least useful on its own |
| Settlement interval | Decides what period that rate covers, and therefore whether it is comparable |
| Next settlement time | Decides whether you can still act on it |
| Predicted rate | The live estimate, which keeps moving until settlement freezes it |
| Rate cap for that pair | Tells you whether the rate can still move or is already at its ceiling |
Track the rate alone and you have one column of a five column problem.
The settlement interval is the one people skip most often, and it is the one that does the most damage. A rate quoted for an hour and a rate quoted for eight hours are different units wearing the same costume.
Order book depth. A strong rate on a thin market is a rate you cannot size into. The number is real and the opportunity is not.
Whether the venue has switched to faster settlement. Several exchanges move a contract to hourly settlement under stress, and the change is not always announced loudly.
Your own fee tier. The same published rate nets differently depending on what you pay to trade, so two accounts can reach opposite conclusions from identical data.
Transfer cost between the two venues. If a spread requires moving collateral, that cost belongs in the comparison rather than in a nasty surprise afterwards.
A tracker that shows rates and nothing else is showing you a shortlist, not a decision.
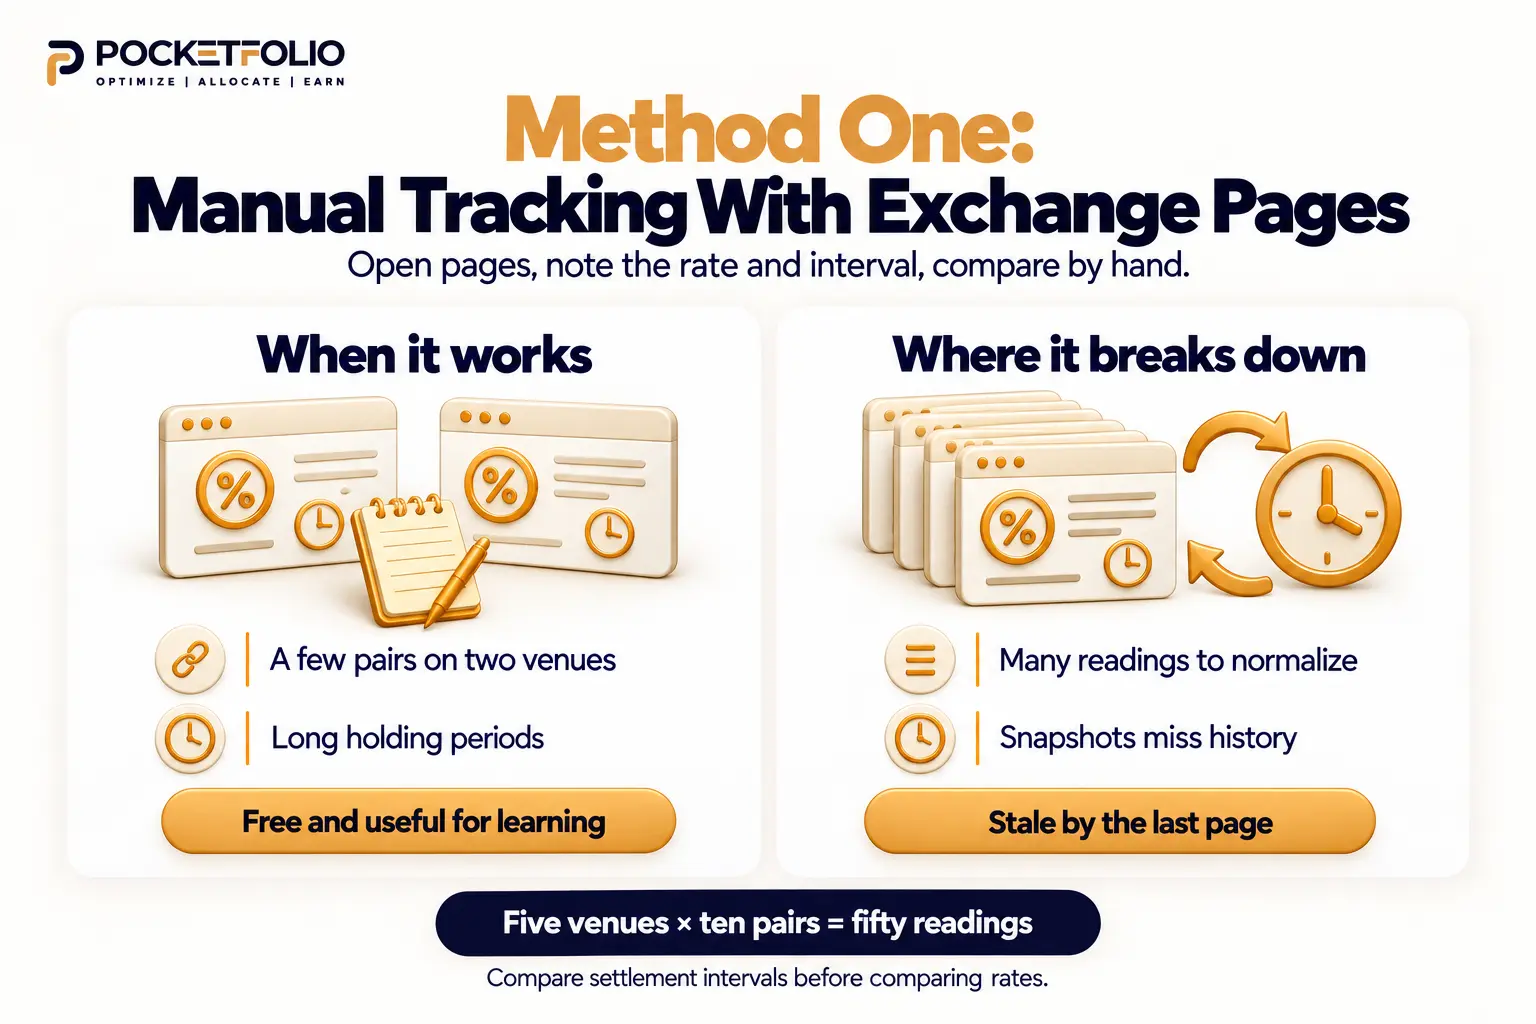
Every major venue publishes a funding page, and they are free to read without an account on most exchanges.
You open each one, note the rate, note the interval, and compare by hand. For someone following two or three pairs on two venues, this is entirely reasonable.
It works when your universe is small and your holding period is long.
If you hold positions for weeks and follow a handful of major pairs, checking by hand once or twice a day costs you very little. The rates you care about move slowly at that scale.
It also works as a learning method. Reading the raw pages teaches you where each venue hides its settlement schedule and its caps, which is knowledge worth having before you automate anything.
It breaks down on arithmetic, not on effort.
Comparing five venues on ten pairs is fifty readings, each needing a conversion to a common period before any two can be held against each other. Do that several times a day and the mistakes arrive quickly.
It also breaks down on timing. By the time you have read the fifth page, the first has moved.
And it cannot see history. A snapshot tells you where a rate sits, never how often it has flipped, which is the more useful question.
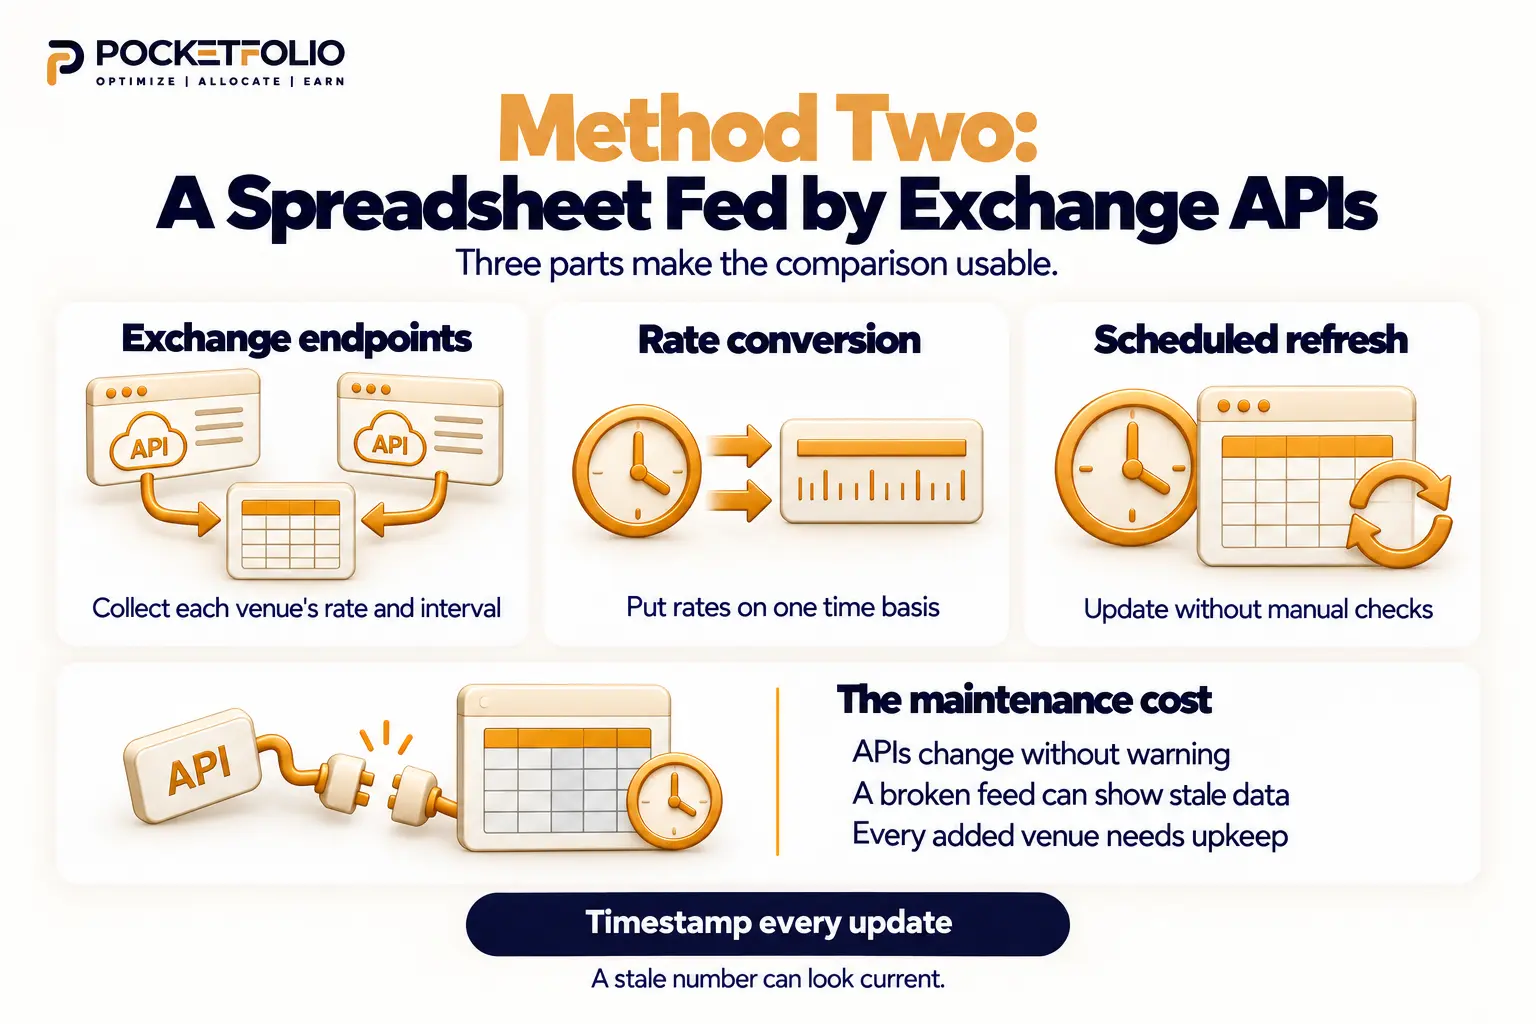
You need three things, and the third is the one people underestimate.
First, the endpoint for each venue you follow. These are documented publicly and differ in structure from one exchange to the next.
Second, a conversion step that puts every rate on a common period. Without it the sheet is a list of incomparable numbers arranged neatly.
Third, a way to run it on a schedule. A sheet you refresh by hand is a manual tracker with extra steps.
APIs change. Field names get renamed, endpoints get versioned, rate limits get tightened, and each of those silently breaks your sheet.
The failure mode is the dangerous part. A broken feed usually does not throw an error at you, it just stops updating, and a stale number looks exactly like a current one.
Adding a venue means new code, because no two exchanges return the same shape of data. So the effort grows with every exchange you add rather than staying flat.
For someone who enjoys building things, this is a good weekend project. For someone who wants to trade, it is a second job that pays nothing.
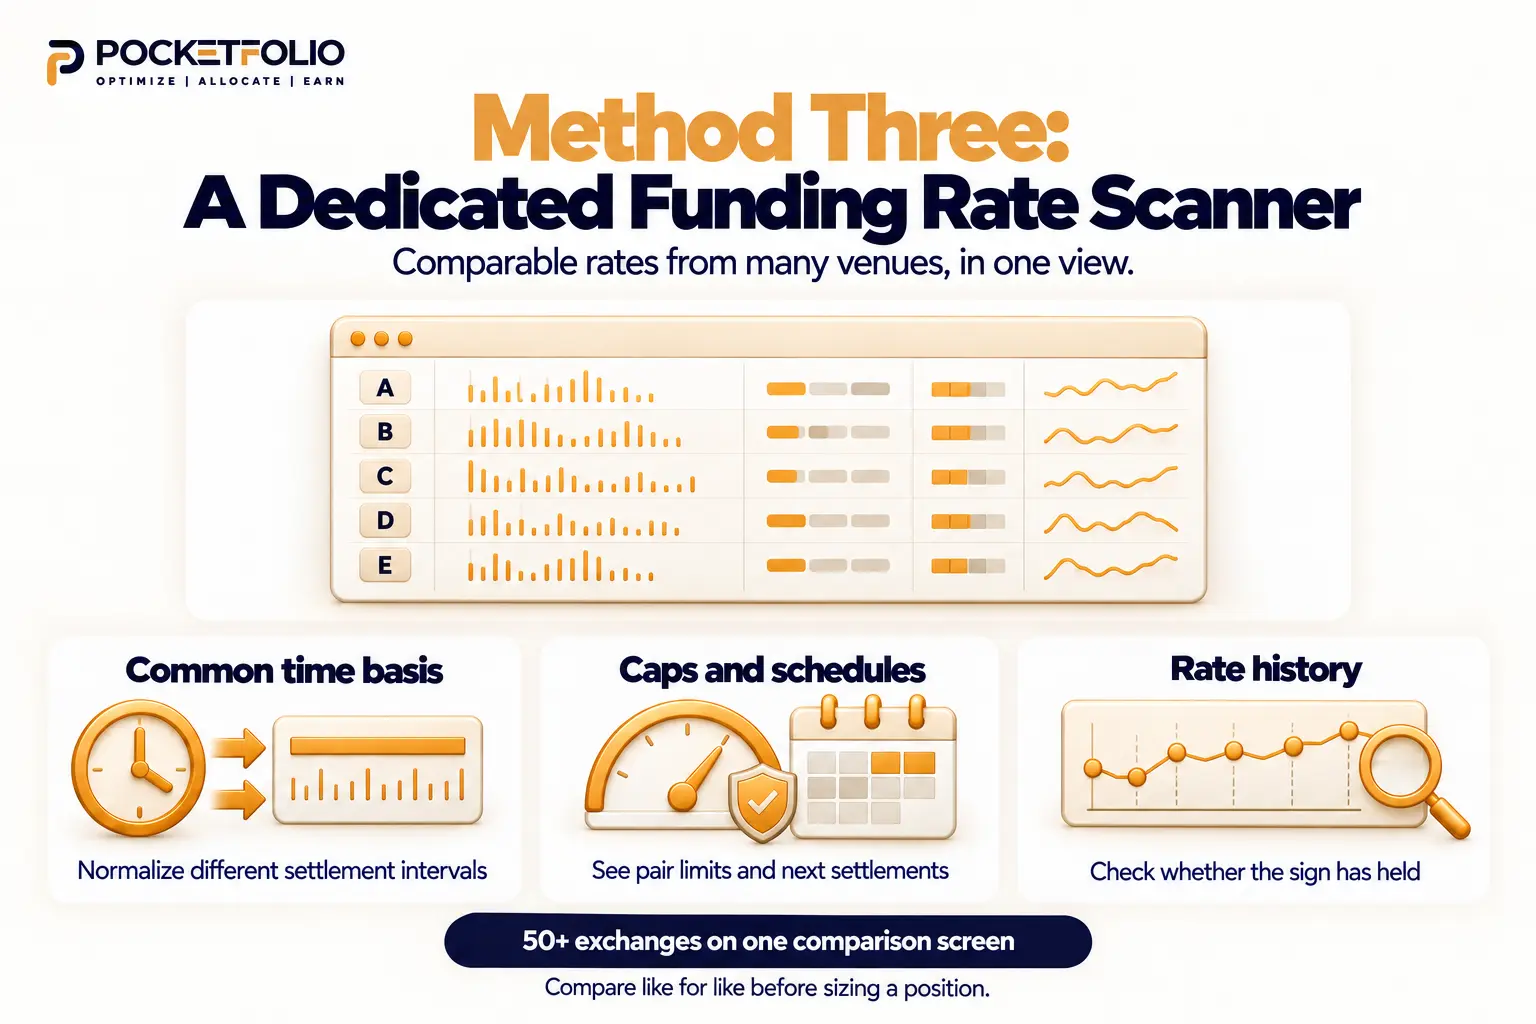
The third method is to use a tool built for the comparison rather than for the collection.
The difference is not that a scanner fetches faster. It is that a scanner has already done the normalisation, the cap lookup and the settlement schedule tracking that a spreadsheet leaves to you.
Pocketfolio’s DIY Trading Scanner, a crypto funding rate arbitrage scanner covering 50+ exchanges, is built around exactly that gap. It puts rates from every tracked venue on one screen, already converted to a common basis, so what you are looking at is a like-for-like comparison rather than a pile of raw readings.
That matters more as your universe grows. The work of tracking one extra venue by hand is linear, and the work of comparing it against every other venue you follow is not.
A scanner also sees history. Knowing that a rate has held its sign for weeks is a different signal from knowing it is high right now, and only the first one is worth sizing into.
| Manual pages | Spreadsheet plus API | Dedicated scanner | |
|---|---|---|---|
| Cost to start | Free | Free | Account or subscription |
| Time to set up | None | Hours to days | Minutes |
| Ongoing time cost | High, and grows with every pair | Low until something breaks | Low |
| Handles normalisation | You do it | You build it | Done for you |
| Tracks settlement changes | Only if you notice | Only if you coded it | Yes |
| Shows history | No | If you store it | Yes |
| Breaks when an API changes | No | Yes, silently | Handled upstream |
| Suits | A few pairs, long holds | Builders who enjoy maintenance | Anyone comparing many venues |
There is no single right answer here. There is a right answer for how many venues you follow and how much of your week you want to spend on plumbing.
This is the part that makes or breaks a multi-exchange comparison, and it is routinely handled incorrectly.
Exchanges publish funding rates for their own settlement period. A venue settling every eight hours publishes an eight hour rate, and a venue settling every hour publishes an hourly one.
Put those two numbers side by side without converting and you are comparing different things.
The arithmetic is simple once you see it. Convert every rate to the same period before you compare, by dividing each one by the number of hours it covers and then multiplying by your chosen common period.
Most people use a daily figure, because it is easy to reason about and it makes the difference between venues obvious.
The mistake runs both ways, which is what makes it so persistent.
Some traders assume an hourly venue must be eight times more expensive than an eight hourly one. It is not, because the hourly venue’s published rate is already scaled down for its shorter period.
Others assume the published numbers are directly comparable and treat an hourly rate as if it covered eight hours. That overstates the hourly venue by a factor of eight, which is a large error to build a trade on.
Both mistakes come from the same root, which is reading the number without reading the period attached to it.
A tracker that does not store the settlement interval alongside the rate cannot do this conversion, however good the rest of it is. That is the first thing worth checking in any tool you rely on.
The honest answer is that it depends on what you are doing with the information.
If you hold positions for weeks, checking once or twice a day is plenty. The thing you are watching for is a change in sign or a sustained drift, and neither of those happens between one hour and the next.
If you are actively hunting spreads to open, you need to see rates close to live. Spreads narrow as other people find them, so a figure from several hours ago describes an opportunity that may no longer exist.
If you already hold a position, the schedule that matters is your venue’s settlement times. That is when anything actually changes hands, so that is when your assumptions get tested.
One rule holds in every case. Check before you size, not after, because a rate that moved between your decision and your execution is the most common way a planned trade turns into an unplanned one.
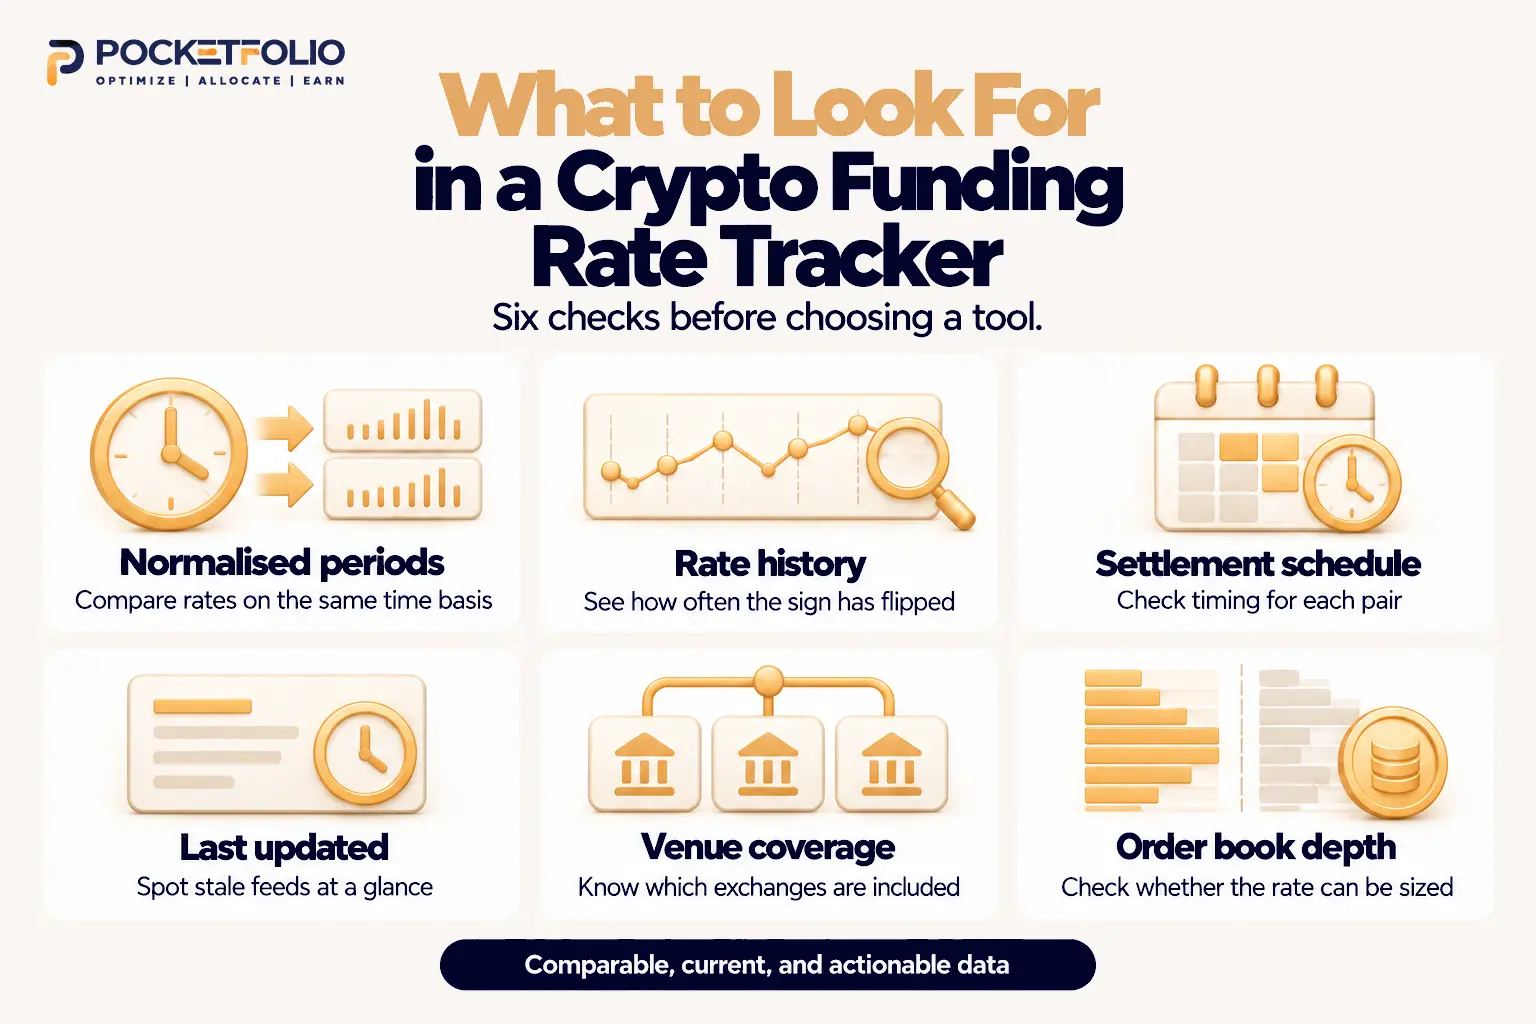
If you are choosing a tool rather than building one, these are the questions worth asking before you commit.
Does it normalise settlement periods? This is the first question, not the last. A tool that shows raw published rates side by side is handing you the comparison problem back.
Does it store history? A rate’s track record tells you far more than its current level. If you cannot see how often the sign has flipped, you cannot judge whether a rate is worth holding.
Does it show the settlement schedule per pair? Schedules differ by contract and change under stress. A tool that assumes a fixed schedule is quietly wrong exactly when it matters.
Does it timestamp its data? Every feed breaks eventually. A visible last-updated time is the difference between noticing and not.
How many venues does it cover, and which ones? Coverage decides your opportunity set. A tool tracking the same three exchanges you already watch adds convenience rather than reach.
Does it show depth alongside the rate? A rate you cannot size into is noise. Tools that ignore the order book will keep surfacing opportunities that evaporate on contact.
Update frequency, past a point. Sub-second refresh sounds impressive and rarely changes a decision, because the trades this data supports are held for days or weeks rather than seconds.
The number of coins tracked. A tool covering thousands of pairs is mostly covering pairs too thin to trade. Depth of coverage beats breadth here.
Alerts, unless they are specific. An alert on any rate above a threshold will bury you. An alert on a spread between two named venues is useful.
Comparing rates without converting the period. Covered above, and worth repeating because it is the most common error by a wide margin.
Trusting the predicted rate as final. Most venues show a live estimate that keeps moving until settlement. It is useful for planning and it is not what you will be paid.
Ignoring the cap. A rate parked at its ceiling looks like a trend when it is really a wall. It cannot climb further however one-sided the market gets.
Assuming the settlement schedule is fixed. Several venues shift a contract to faster settlement under stress. A schedule you assumed rather than checked is a schedule that can cost you a round.
Tracking rates without tracking depth. A rate you cannot size into is not an opportunity. The order book decides whether the number is reachable.
Letting a stale feed look live. A broken API usually fails quietly. Build a timestamp into anything you rely on, so you can see at a glance when it last actually updated.
Watching only the majors. Rates on smaller pairs move differently and are often where the wider spreads sit. They also carry thinner books, which is the trade-off.
For a few pairs on two or three venues, reading the exchange funding pages by hand is fine and costs nothing. Past that, a dedicated scanner saves more time than it costs, because the comparison work grows faster than the collection work.
Yes, using each venue’s public funding endpoint, most of which need no API key to read. Build in a conversion step for settlement periods, or the sheet will collect numbers that cannot be compared with each other.
Usually not, since funding data is public on most major venues. Keys are generally needed for account data and trading rather than for market data.
Enough to see a spread, which usually means at least three. Tracking more widens the opportunity set and raises the cost of comparing, which is the point at which most people automate.
Each venue sets its rate from its own order book and its own premium index, so genuine differences are normal. Part of the gap can also be an illusion caused by different settlement periods, which is why conversion comes before comparison.
Comparing published rates without converting them to a common period. An hourly rate and an eight hour rate are different units, and treating them as the same number is an error large enough to reverse a decision.
Use the predicted rate for planning and the settled rate for accounting. The predicted figure keeps moving until settlement, so it tells you where things are heading rather than what was paid.
Rarely as a default, but several venues switch a contract to faster settlement when a rate hits its cap. Because that change is tied to market stress, it tends to happen exactly when you are paying most attention to the rate.
It depends whether it normalises periods and stores history, since a tool that does neither is a data feed rather than a comparison tool. Check those two things before relying on any tracker, free or paid.
Look for a visible last-updated timestamp, and treat its absence as a warning. Broken feeds usually fail silently, so a stale number and a current one look identical without one.
Share this article
Share this article
Best Exchanges for Crypto Funding Rate Arbitrage
The best exchanges for crypto funding rate arbitrage are not
Is Crypto Funding Rate Arbitrage Still Profitable?
Is crypto funding rate arbitrage still profitable? In roughly a
Crypto Funding Rate Arbitrage in a Bear Market
Crypto funding rate arbitrage in a bear market does not
You may be interested in these blogs
Best Exchanges for Crypto Funding Rate Arbitrage
The best exchanges for crypto funding rate arbitrage are not the ones with the lowest fees or the deepest books.
Is Crypto Funding Rate Arbitrage Still Profitable?
Is crypto funding rate arbitrage still profitable? In roughly a tenth of the market, yes. In most of the rest
Crypto Funding Rate Arbitrage in a Bear Market
Crypto funding rate arbitrage in a bear market does not stop working. It gets smaller, and the version that replaces
Ready to Explore the Platform?
Explore AI-powered tools for analyzing arbitrage opportunities.
No fees. No risk. Cancel anytime.

Ready to Explore the Platform?
Explore AI-powered tools for analyzing arbitrage opportunities.
No fees. No risk. Cancel anytime.

New breakdowns on funding rates, arbitrage and market structure will arrive at your inbox.