Is crypto funding rate arbitrage still profitable? In roughly a tenth of the market, yes.
In most of the rest it barely covers the cost of trading, and in about a sixth you would be paying rather than collecting.
That answer needs a measurement rather than an opinion, so we took one.
On 23 October 2026 we read the current funding rate for every perpetual on Bybit and Binance, 1,335 contracts in total. Each one was then compared against what it costs to open and close the position.
Nobody else seems to publish that comparison. Of the five guides we read while researching this, not one measures what share of the market clears its own trading costs.
The Short Answer
Three measured findings, before the detail.
Only about one contract in ten pays above the formula’s own baseline. That was 9.2% on Bybit and 12.8% on Binance at capture.
The median positive contract needs 8 days of holding just to cover its fees. Both venues returned exactly 8 days, independently.
Roughly one in six contracts is negative, at 16.6% and 16.5%. On those you pay to hold a position rather than being paid.
So the strategy still works. It works in a minority of the market, and finding that minority is the whole job.
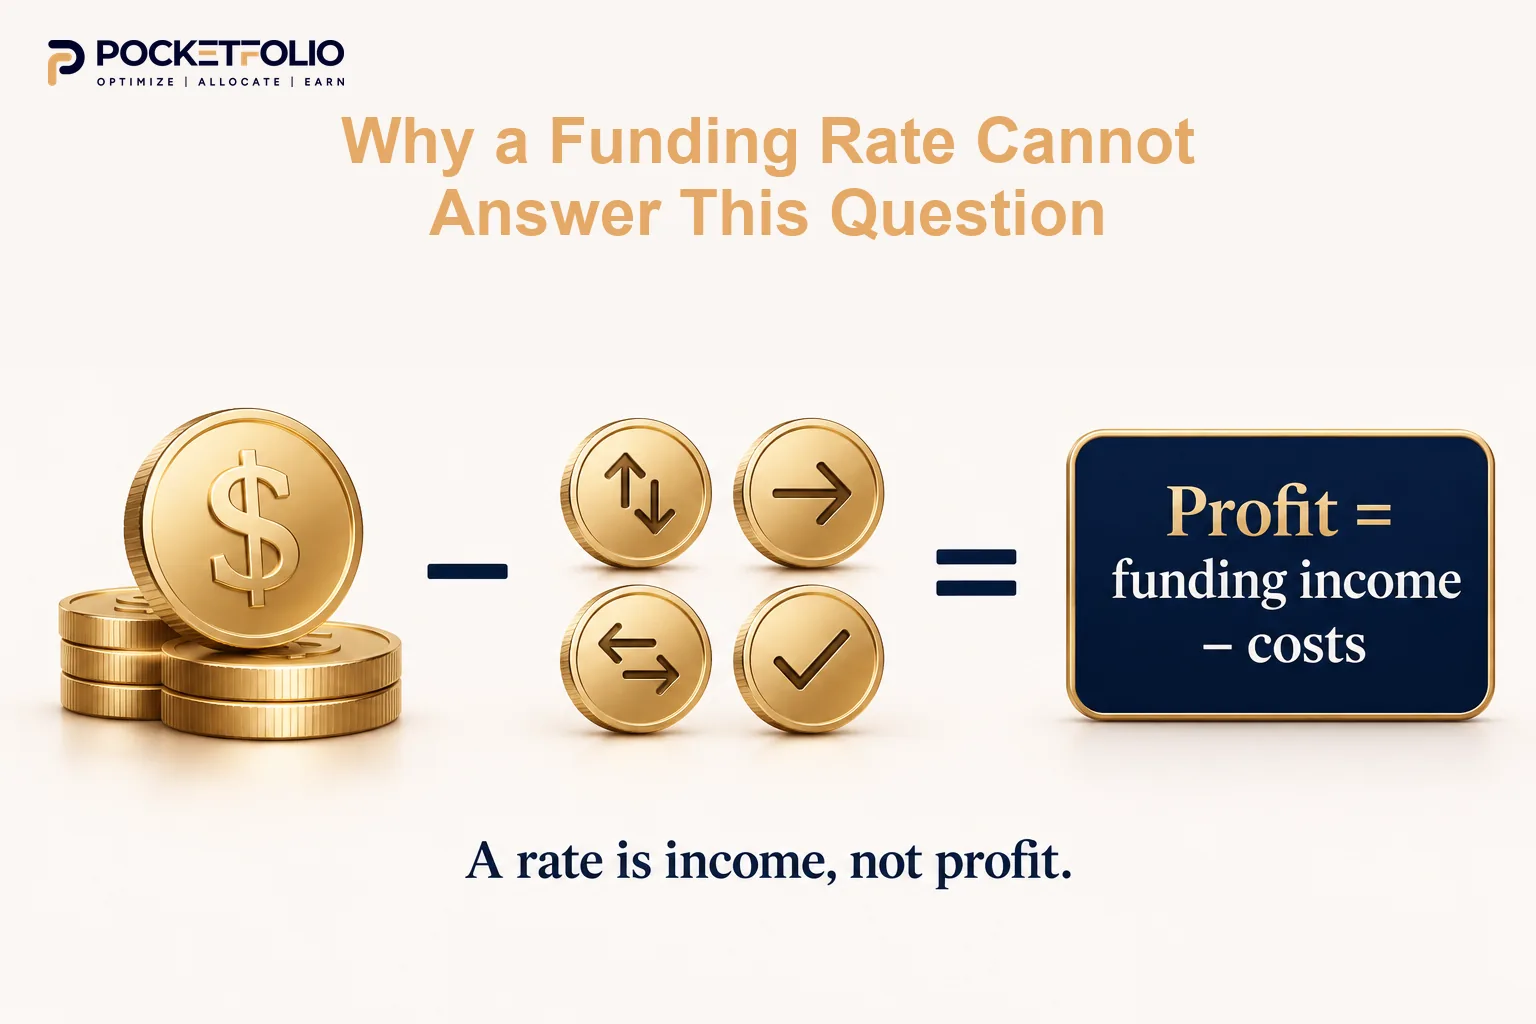
Why a Funding Rate Cannot Answer This Question
Every guide we read answers profitability with a rate, usually annualised. That is the wrong unit, and the reason is arithmetic rather than opinion.
A funding rate is income. Profit is income minus cost, and the cost of a hedged position is fixed and known in advance.
A hedged trade needs four fills. You buy spot, short the perpetual, then later close both. On Bybit’s VIP 0 schedule that is 0.10% spot maker and 0.02% perpetual maker, which comes to about 0.24% of notional across the round trip.
That cost does not shrink with the rate. So a contract paying very little is not a small profit; it is a loss until enough settlements have accumulated to cover the 0.24%.
The useful question is therefore how many days of holding a contract needs to pay for itself. That converts a rate into something you can actually judge, and it is the measurement this guide is built on.
The baseline most guides mistake for an opportunity
The funding formula carries a fixed interest rate component, commonly 0.01% per 8 hours. While the premium index sits inside a narrow band, the finished rate prints at exactly that figure.
So the baseline is what the rate shows when nothing is happening. It is a floor rather than a signal.
A contract sitting at or below it is not offering a premium to harvest, which makes the baseline the natural line to measure against. Our guide to crypto funding rate caps covers how the baseline, the clamp and the cap differ.
What We Measured, and What It Showed
For every contract with live non-zero funding we recorded two things. Where its rate sat relative to the 0.01% baseline, and how many days of holding it would need to clear a 0.24% round trip.
The hold figure uses each contract’s own settlement interval rather than assuming 8 hours, because intervals vary by contract on both venues.
| Band | Bybit (664 contracts) | Binance (671 contracts) |
|---|---|---|
| Above the 0.01% baseline | 9.2% | 12.8% |
| Exactly at the baseline | 14.6% | 7.2% |
| Positive but below the baseline | 59.6% | 63.5% |
| Negative | 16.6% | 16.5% |
Two venues measured separately agree closely on the two figures that matter, the share above the baseline and the share negative.
Only about one contract in ten offers a real premium
This is the finding that answers the question, and it is worse than the usual framing suggests.
Around three quarters of contracts sat at or below the formula’s floor while still being positive. They pay something, just not enough to call an opportunity.
So the market is not broadly profitable with a few bad apples. It is narrowly profitable with a large marginal middle, and the difference matters for how you approach it.
 Eight-day timeline marking when the median positive contract clears trading costs.](https://pocketfolio.com/wp-content/uploads/2026/10/profitable-arbitrage-04-eight-day-break-even.webp)
The median contract needs 8 days to pay for itself
Here is the same data expressed as hold time, which is the version you can act on.
| Hold needed to clear 0.24% | Bybit contracts |
|---|---|
| 2 days or less | 22 |
| 2 to 4 days | 24 |
| 4 to 8 days | 451 |
| 8 to 30 days | 45 |
| Over 30 days | 12 |
The median positive contract needed 8 days, and the same median came back from Binance’s separate dataset. Only 22 of 664 contracts on Bybit would have cleared their costs within two days.
That reframes the risk. Eight days is eight days of counterparty exposure, margin monitoring and rate risk, incurred before the position has made anything at all.
Our guide to when to close a crypto funding rate arbitrage position explains why the exit threshold sits below the entry one. That matters more when the hold is long.
Bitcoin was below the baseline on both venues
Worth stating plainly, because it contradicts the assumption that the majors are where this trade lives.
Bitcoin printed 0.0055% per 8 hours on Bybit and 0.0086% on Binance at capture, both under the 0.01% floor. At those rates the position needed 14.6 days on Bybit and 9.3 days on Binance just to cover opening and closing.
So the most liquid contract on the two largest venues was among the least rewarding at that moment. The trade is not where the volume is.
Does Liquidity Help? What the Turnover Subset Shows
A reasonable hope is that the thin contracts drag the average down, and that sticking to markets with real turnover gives a better picture.
We tested it. Restricting the Bybit set to contracts with 24 hour turnover above one million USD leaves 240 of the 664.
| Measure | All contracts | Turnover above 1m USD |
|---|---|---|
| Above the 0.01% baseline | 9.2% | 11.7% |
| Negative | 16.6% | 25.4% |
| Clearing a round trip within 8 days | 74.8% | 57.5% |
Liquidity helps slightly on one measure and hurts on two. Marginally more liquid contracts pay above the baseline, but considerably more of them are negative, and fewer clear their costs within 8 days.
So the liquid subset is more dispersed rather than uniformly better. That makes sense if funding reflects crowding, since the markets people actually trade are the ones where positioning gets lopsided.
The practical reading is that you cannot filter your way to profitability using turnover alone. A liquidity screen is still worth applying for execution reasons, since it decides whether you can enter at the price you expected. But it does not solve the selection problem.
 A single funding snapshot cannot establish a measured annual return.](https://pocketfolio.com/wp-content/uploads/2026/10/profitable-arbitrage-05-annualised-return.webp)
Why We Are Not Giving You an Annualised Return
Every competitor we read leads with one. We are not going to, and the reason is the clearest thing this guide has to say.
Annualising a snapshot assumes the rate persists for a year. Funding is a settlement-moment reading that changes every few hours, so the assumption is false by construction.
The guides doing it are explicit about the inputs if you read closely. One takes a hypothetical spread of 0.03% per 8 hours and reports roughly 32.8% APY from it, which is correct arithmetic on an invented figure.
Another annualises the 0.01% baseline to 10.95% before fees, which describes the floor rather than an opportunity.
A third carries a 19.26% average annual figure in its meta description that its own body never explains or sources.
None of those is a measured return. They are single rates multiplied by a year. Our census shows why that fails: the distribution is wide, the median contract takes 8 days to break even, and a sixth of the market is negative.
Our guide to how to make money with crypto funding rate arbitrage works through the full cost stack. Use it to build the arithmetic for your own position and fee tier.
What This Means If You Are Deciding Whether to Start
The measurement points to a few specific conclusions rather than a verdict on the strategy.
Selection is the entire edge. If a tenth of contracts pay above the floor, your return comes from finding them rather than from the strategy being good.
A long hold is a risk, not just a wait. Eight days of exposure to earn back your fees is a real cost even when nothing goes wrong. The capital is committed and the rate can turn.
Your fee tier changes the answer materially. We used a maker round trip at the entry-level tier. A taker round trip runs closer to 0.31%, which lengthens every hold figure in the table above.
Small positions face the same percentage cost. Trading fees are proportional, so they do not punish small accounts, but fixed transfer costs do. Our guide to how much capital you need for crypto funding rate arbitrage works through where that floor sits.
Compare against doing nothing. If the median contract needs 8 days to break even, the opportunity cost of that capital is a live part of the decision rather than a footnote. Our guide to crypto funding rate arbitrage vs holding stablecoins sets the two against each other directly.
Your maker fee is the lever you actually control
Most of this guide describes conditions you cannot change. The fee side is the exception.
The round trip we measured against uses the entry-level maker fee on both legs. Paying taker fees on all four fills instead pushes the round trip to roughly 0.31%, which is about a third more cost for the same position.
That turns straight into hold time. A contract that needed 8 days at maker fees needs closer to 10 at taker fees, with the extra days adding exposure rather than income.
So using limit orders rather than market orders is worth more here than it looks. A fee tier improvement raises every contract’s chance of clearing its costs at once.
Our guide to how crypto funding rate arbitrage actually works covers order type choice and leg sequencing, which is where that saving is won or lost.
Rate compression is a real trend, and this is what it looks like
The usual explanation for thinner returns is that the trade has become crowded, and standing capital arrives to take the paying side whenever rates climb.
Our census is consistent with that. A large middle sitting at or just below the formula’s floor is what a compressed market looks like in cross-section.
Our guide to the future of crypto funding rate arbitrage covers the compression trend and what else is changing. What this guide adds is the measurement at one moment rather than the direction of travel.
 Scanner narrows many contracts to a shortlist without changing their funding rates.](https://pocketfolio.com/wp-content/uploads/2026/10/profitable-arbitrage-06-pocketfolio-fits.webp)
Where Pocketfolio Fits
If a tenth of the market is worth trading, the work is search rather than judgement. That is a different problem from the one most guides describe.
Checking the rate, the settlement interval and the fee tier for every contract on several venues is not something you do by hand. The viable set also moves between settlements.
Pocketfolio’s DIY Trading Scanner, a crypto funding rate arbitrage scanner covering 50+ exchanges, puts live funding rates in one normalised view.
Against the census above, the useful part is narrowing to the small share paying above the floor rather than reading any single venue’s number.
The Smart Yield Pool handles execution once you have judged a trade worth taking.
Neither changes the arithmetic in this guide. A scanner cannot make a compressed market pay more, it cannot shorten an 8-day break even, and it does not remove the four fills.
What it removes is the part that got harder as rates compressed, which is finding the minority of contracts where the trade still clears its costs.
Is Crypto Funding Rate Arbitrage Still Profitable? The Verdict in One Table
Everything above, compressed, so the answer is in one place.
| Question | Measured answer |
|---|---|
| Does the strategy still work | Yes, in a minority of markets |
| Share paying above the formula’s baseline | 9.2% on Bybit, 12.8% on Binance |
| Share where you would be paying | 16.6% and 16.5% |
| Median days to cover a round trip | 8, on both venues independently |
| Contracts clearing costs within 2 days | 22 of 664 on Bybit |
| Was Bitcoin a good market at capture | No, below the baseline on both venues |
| Does filtering by turnover fix it | No, the liquid subset was more negative |
| What decides your result | Which contract you pick, not the strategy |
The strategy is not broken and it is not generous. It pays in the slice of the market where a real premium exists, and the delta neutral structure does nothing to create that premium on its own.
Who Should Probably Not Bother
An honest profitability guide has to include this, and most do not.
If you cannot hold for a week or more, the median contract will not have covered its fees, so you are paying to find out.
If you are trading at taker fees, your round trip is roughly a third higher and the hold figures above all get longer.
If you only want to trade Bitcoin, our capture had it below the baseline on both venues, so the liquid majors are not reliably the opportunity.
If you will not monitor the position, a rate that turns negative converts a slow gain into a steady cost. About a sixth of contracts were already negative.
If the capital has a decent alternative, the comparison matters more than usual when the median trade needs 8 days to reach zero.
None of that makes the strategy bad. It makes it conditional, and the conditions are measurable rather than matters of opinion.
 Wider rate dispersion, room below funding caps, and lower trading fees as factors affecting opportunities.](https://pocketfolio.com/wp-content/uploads/2026/10/profitable-arbitrage-07-what-improves-profitability.webp)
What Would Make the Answer Better
The census describes one morning. Three things would move it, and two of them are outside your control.
Dispersion rather than higher rates. The trade needs some contracts paying well above the floor, not the whole market lifting. A volatility event that pushes positioning lopsided in a handful of markets widens the paying slice.
Headroom exists for that to happen. Published funding rate caps sit far above anything these markets normally produce, so the ceiling is not what limits the opportunity. Our guide to crypto funding rate caps sets the published limits against observed maxima.
A better fee tier, which you do control. Lower fees shorten every hold figure at once, and that is the only input in this measurement you can change by trading more or trading better.
What would not help is waiting for the strategy itself to improve. Standing capital arrives whenever rates climb, which is the mechanism that compressed them in the first place.
Frequently Asked Questions
Is crypto funding rate arbitrage still profitable in 2026?
In a minority of markets, yes. Our 23 October 2026 census found 9.2% of Bybit's and 12.8% of Binance's contracts paying above the formula's 0.01% baseline, with roughly a sixth negative.
What return does crypto funding rate arbitrage pay?
We will not quote one, because every published figure we found comes from annualising a single rate as though it lasted a year. Funding is a settlement-moment reading that changes every few hours.
How long does a position take to break even?
The median positive contract in our census needed 8 days to clear a 0.24% maker round trip. The same median came back from both venues separately.
Has the strategy got worse over time?
The cross-section is consistent with rate compression, since most contracts sat at or below the formula's floor. One snapshot cannot measure a trend, so we are describing shape rather than direction.
Why do other guides quote 10% to 30% a year?
Those figures annualise one hypothetical or current rate. One guide we read reaches roughly 32.8% from an invented 0.03% spread, and another carries a 19.26% figure its body never sources.
Is Bitcoin a good market for this strategy?
Not reliably. At our capture Bitcoin was below the 0.01% baseline on both venues, needing 14.6 days on Bybit and 9.3 on Binance to cover its own fees.
What does the round trip actually cost?
Four fills, because you open and close two legs. At Bybit's entry-level maker schedule that is about 0.24% of notional, and roughly 0.31% at taker fees.
Does a bigger account earn a better percentage?
Not from fees, which are proportional. Fixed transfer costs favour larger accounts and slippage works against them, so the effects partly cancel.
Does the settlement interval change profitability?
Not the daily cost. A shorter interval divides the rate across more payments, so the daily total is unchanged, though it does change timing risk.
What is the single biggest factor in whether this pays?
Selection. With about a tenth of contracts paying above the baseline, your result depends far more on which contract you pick than on the strategy itself.
Sources and Methodology
Funding rates were read first-hand from exchange public endpoints on 23 October 2026, between 07:22 and 07:24 UTC. We pulled the current rate for every perpetual on Bybit and Binance, 1,335 contracts with live non-zero funding, along with each contract's settlement interval.
The cost basis is Bybit's published VIP 0 schedule: 0.10% spot maker and 0.02% perpetual maker. Four fills gives about 0.24% of notional for a round trip.
The hold-time figures are our own arithmetic from that schedule and each contract's own daily funding, not figures quoted from anywhere.
Contracts returning funding of exactly zero were excluded, as were tokenised equity perpetuals, which form most of that bloc and are a separate product class.
What this census cannot establish
One moment on two venues. It shows the shape of the market at capture and says nothing about how long any contract stays in its band.
So it is not a base rate, and we have not used it as one.
Slippage is excluded because it cannot be read from a public endpoint. Including it would lengthen every hold figure, so the numbers here are the optimistic end rather than a best estimate.
The cost basis is one venue's entry-level maker tier applied uniformly. A different fee tier or a taker round trip changes every hold figure, which is why the method is stated rather than just the result.
Hyperliquid was excluded, since its hourly settlement and separate fee schedule would need their own cost basis. OKX endpoints could not be reached from where this was written.
How the competitive claim was scoped
The statement that no competing guide measures the share of markets clearing costs refers to the five guides read in full for this article. It is not a claim about the whole field.
Figures attributed to those guides are their published numbers, described rather than reproduced, and we have not verified the underlying data for any of them.
No figure in this guide is a Pocketfolio rate, yield, return or product metric, and no annualised return appears anywhere.