Learning how to read a crypto funding rate history chart matters more than reading the current rate, because one settlement tells you almost nothing.
A rate that is high today may have been high for an hour or for a month. Those are different trades.
The history is where that difference lives. It is also where you find out whether a rate is worth holding, whether its sign is stable, and whether the venue you are looking at agrees with the rest of the market.
This guide covers what to look at on the chart, what each pattern means, and a live cross-venue snapshot that shows why one chart is never enough.
How to Read a Crypto Funding Rate History Chart: The Five Things That Matter
Most people look at the level. The level is the least informative part.
The sign. Whether the rate is positive or negative tells you which side is paying. It is the single most important feature on the chart.
The persistence. How long the sign has held. Rate persistence separates a signal worth trading from one positive only since this morning.
The flip frequency. How often a sign flip has occurred. Frequent flips mean an unreliable income stream regardless of the average level.
The shape. A smooth drift and a jagged series of spikes can produce the same average and demand completely different handling.
The ceiling. Whether the series has been pressed flat against the venue’s rate cap, which looks like strength and is actually a wall.
Read those five before you read the number.
What the Sign Tells You
A positive rate means longs pay shorts, which happens when the perpetual trades above spot. A negative rate means the reverse.
For crypto funding rate arbitrage, the sign decides the shape of the trade. Positive points toward long spot and short perpetual, because the short leg is the side collecting.
The common assumption is that the sign is almost always positive. On most assets most of the time it is, which is exactly why the exceptions are worth noticing.
Our snapshot below found Bitcoin negative on two major venues on the same day. That is not an exotic event, and anyone whose chart reading assumes a permanently positive sign will be surprised by it.
Persistence Beats Level
This is the part competitors tend to skip, and it decides more trades than the rate itself.
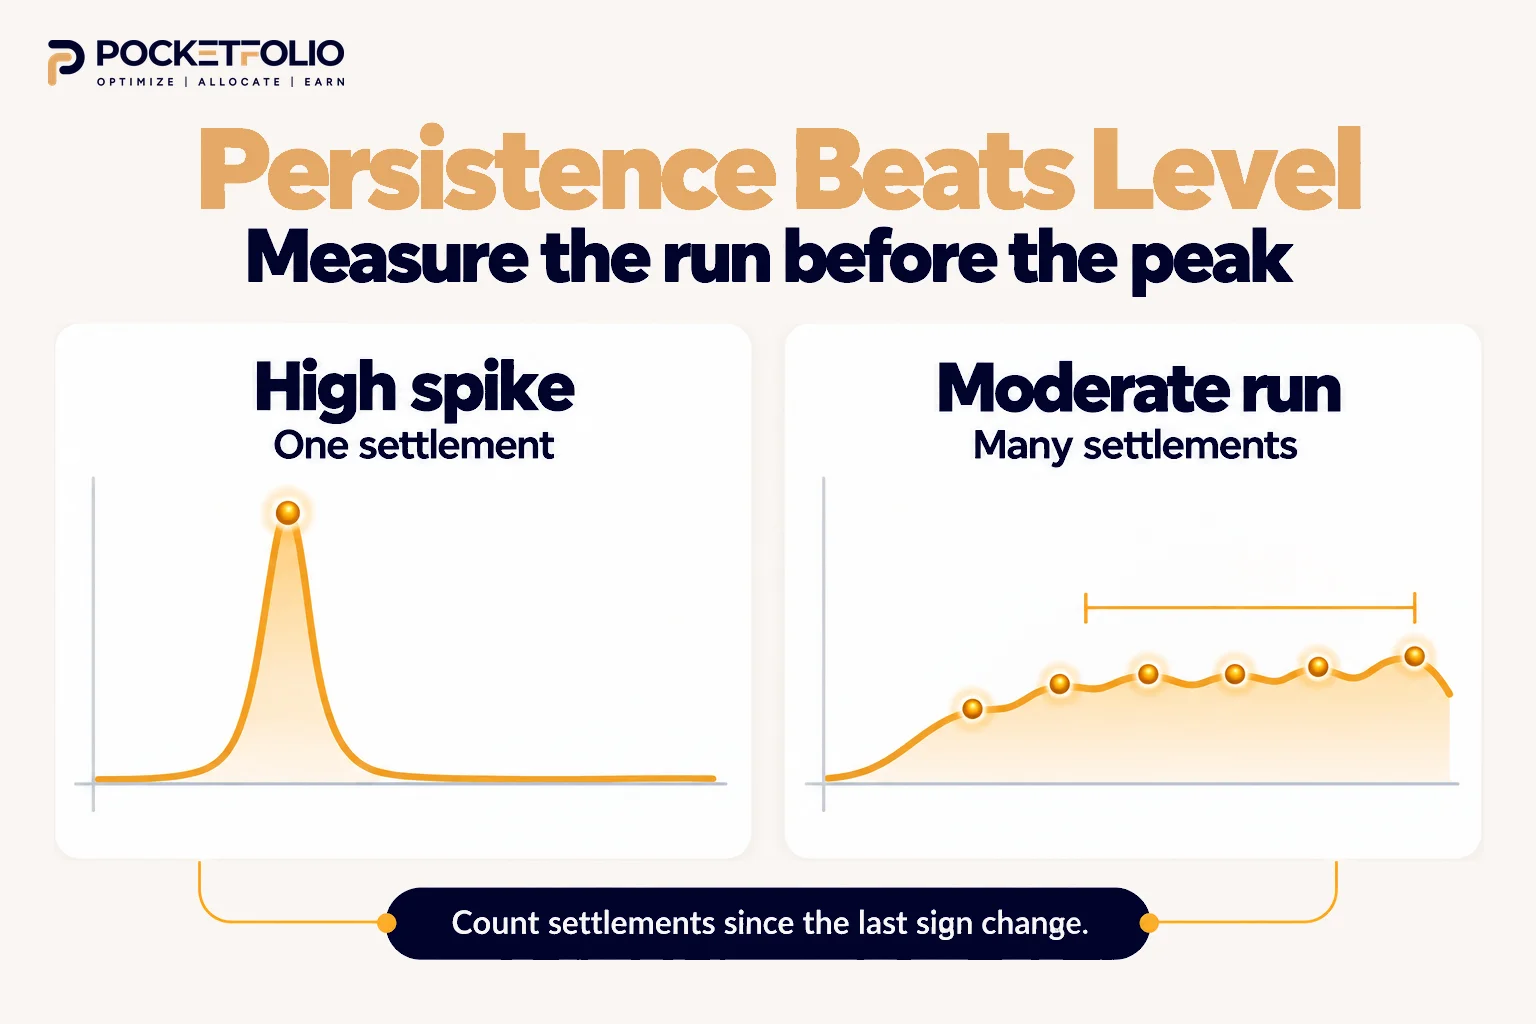
A high rate that has existed for one settlement is a spike. A moderate rate that has held its sign for weeks is an income stream.
The second is worth more, because the trade has to clear four fills before it earns anything. A rate that disappears before you break even was never an opportunity.
So when you look at a history chart, measure the length of the current run before you look at its height.
How to measure a run on the chart
Find the most recent sign change and count settlements forward from there. That count is the age of the current regime.
Compare it against the typical run length visible elsewhere on the same chart. If the current run is already longer than most, that is information, though not necessarily a reason to expect it to end.
Then check whether the run is steady or sagging. A positive rate that has been falling for a week is still positive and is telling you something the sign alone does not.
Our guide to when to close a crypto funding rate arbitrage position covers what to do once that drift becomes a decision.
What Two Live Readings Ninety Minutes Apart Actually Show
Here are two real readings of Bitcoin funding, taken on 6 October 2026 about ninety minutes apart. Every rate is normalised to an 8 hour period by the source.
These are two dated observations, not an average and not a forecast. They are included because what changed between them is the lesson.
| Venue (BTC) | First reading | Second reading | What happened |
| Hyperliquid | +0.0100% | +0.0100% | No change at all |
| Huobi | +0.0100% | -0.0057% | Flipped sign |
| Kraken | +0.0033% | +0.0082% | More than doubled |
| Bybit USDT | +0.0032% | +0.0001% | Collapsed to near zero |
| Bybit USDC | +0.0029% | +0.0040% | Rose |
| OKX | +0.0026% | +0.0032% | Small rise |
| Binance USDC | +0.0010% | +0.0030% | Tripled |
| Deribit | +0.0000% | +0.0058% | Moved off zero |
| Binance USDT | -0.0015% | -0.0016% | Held negative |
| WOO X | -0.0015% | -0.0015% | Unchanged |
| Binance (coin-margined) | +0.0003% | +0.0053% | Rose sharply |
| Bybit (coin-margined) | +0.0043% | +0.0043% | Unchanged |
| OKX (coin-margined) | -0.0019% | +0.0021% | Flipped sign |
What changed between the two readings
Four things in that table are worth more than any single row.
A sign flip happened inside ninety minutes. Huobi went from the baseline to clearly negative, and OKX’s coin-margined contract went the other way.
Anyone reading a daily chart would have seen neither.
Venues disagreed on the sign in both readings, and the disagreement moved. The first reading had Binance USDT, WOO X and OKX coin-margined negative, while the second had Binance USDT, WOO X and Huobi.
The set changed while the disagreement persisted.
One venue did not move at all. Hyperliquid sat at exactly +0.0100% in both readings, matching the interest rate component documented across major venues.
A rate pinned to its floor is a quiet market, not a signal.
Several venues moved sharply while looking quiet. Kraken more than doubled and Bybit USDT collapsed to near zero, both without crossing zero and both invisible on a chart sampled once a day.
What this means for how far apart you sample
A chart’s resolution decides what it can show you.
Sample daily and the Huobi flip is invisible, because the series might well close positive again. Sample each settlement and it is obvious.
That matters because your position is exposed at every settlement, not at the close of a daily candle. The chart should match the frequency at which money actually moves.
Why the predicted column deserves its own warning
Across the two readings, the predicted rate reversed direction on five contracts.
Binance USDT’s prediction went from positive to negative, and Bybit’s coin-margined prediction went from negative to positive.
In both cases the settled rate barely moved while the estimate swung across zero.
So a prediction is a reading of the moment you took it, with a shorter shelf life than the settled history beside it.
The same moment, across assets
A second aggregator, checked the same day, showed how wide the range gets once you leave Bitcoin.
TRX read around -0.04% across several venues while Monero read +0.10% on one. Both at the same moment as the Bitcoin readings above.
So “the funding rate” is not one thing moving together. It is hundreds of separate series, and a chart for one asset says nothing about another.
Normalisation: The Trap Before You Compare Anything
Two history charts are only comparable if they cover the same settlement interval, and by default they do not.
A venue settling every eight hours publishes an eight hour rate, and a venue settling hourly publishes an hourly one.
The numbers look alike and mean different things.
The snapshot above is normalised to 8 hours, which is why its rows can sit in one table. Raw venue charts usually are not.
Convert before you compare, or the comparison is noise. Our guide to how to track crypto funding rates across multiple exchanges covers the conversion and the three ways people handle it.
Predicted Versus Settled on the Same Chart
Most funding pages show two different things and do not always label them clearly.
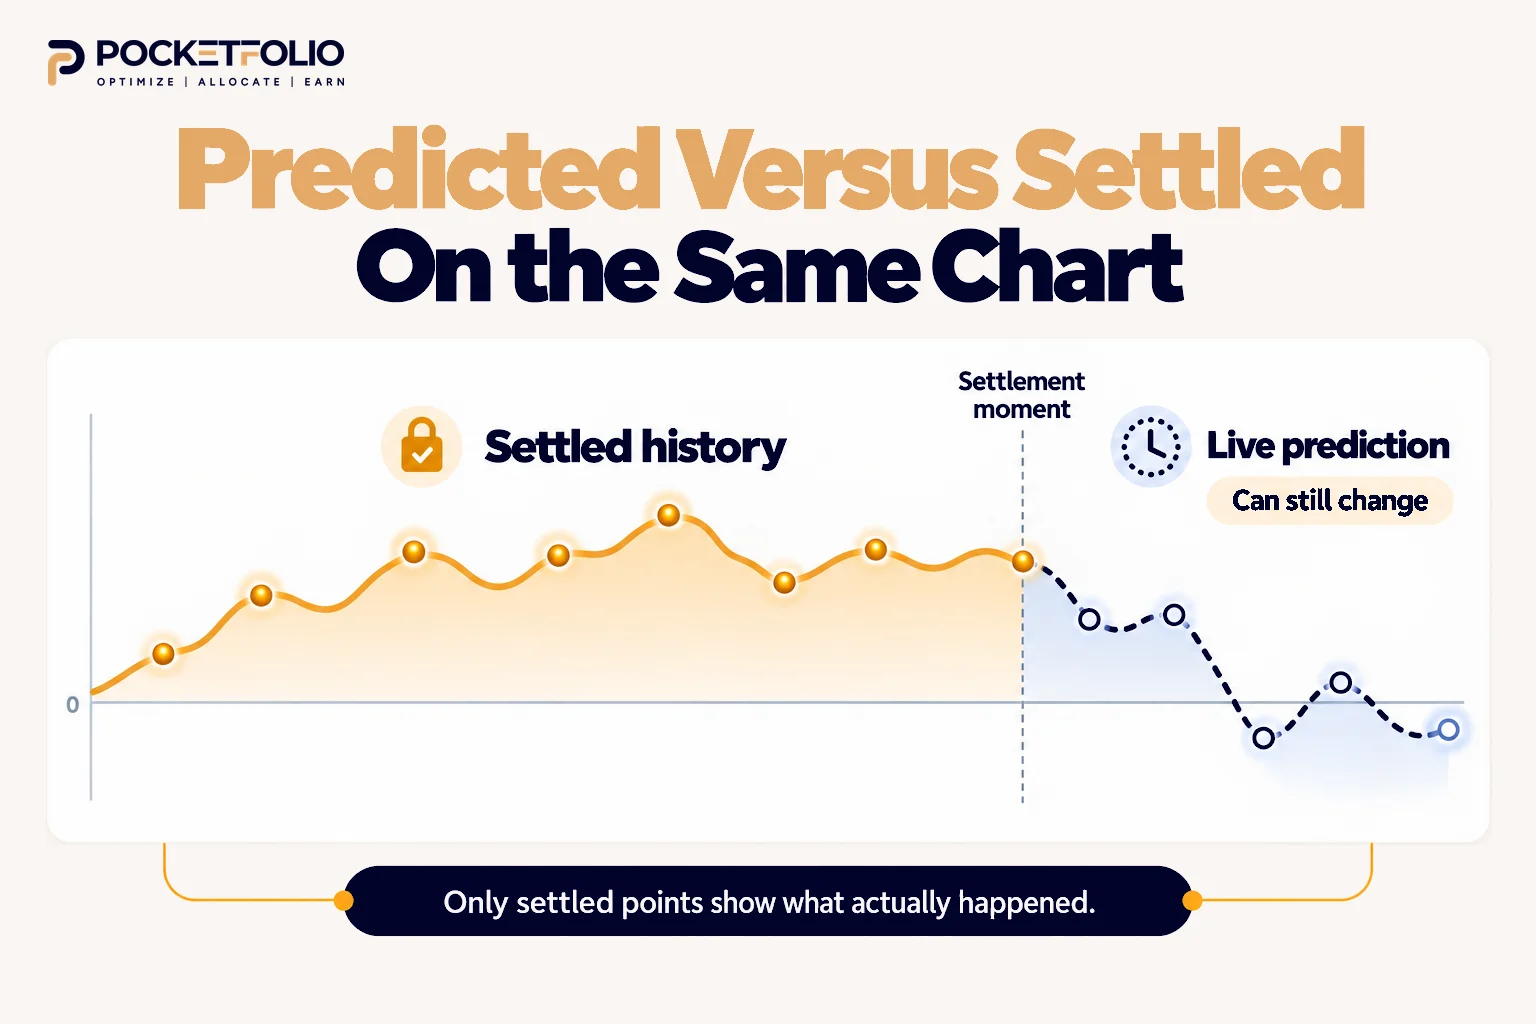
The settled history is what actually changed hands. It is fixed, and it is the only honest record.
The predicted funding rate is a live estimate that keeps moving until the settlement moment freezes it. It is useful for planning and it is not a fact yet.
Our snapshot shows why the distinction matters. Several venues’ predicted values pointed the opposite way from their current ones, including two that crossed zero.
So read a history chart for what happened, and treat the rightmost point with suspicion if it is an estimate rather than a settlement.
Reading the Shape, Not Just the Line
Two charts with the same average can describe completely different markets.
A flat, steady series is the easiest to trade. The income is predictable and the exit decision is slow.
A jagged series around a positive mean averages out on paper and punishes you in practice, because you must be present through the troughs and some of them will be negative.
A series pressed against a flat ceiling is at its cap. It cannot climb further however one-sided the market gets, and on some venues hitting that ceiling also switches settlement to hourly.
A series that steps rather than drifts often reflects a venue changing its own parameters rather than the market moving.
The shape tells you how much attention the position will need. The average does not.
What a History Chart Cannot Tell You
Being clear about the limits matters as much as reading the patterns.
It cannot show depth or open interest. A high rate on a thin book is a rate you cannot size into, and the chart looks identical either way.
It cannot show your costs. Four fills and any transfers sit between the chart and your account.
It does not predict. A long positive run is a description of the past, not a promise about next week.
It usually hides the venue’s own changes. Settlement schedule and cap changes can move the line without the market moving at all.
It says nothing about the other side of your trade. For crypto funding rate arbitrage you need the cross venue spread, which no single funding rate chart contains.
That last limit is the one our snapshot demonstrates most clearly, and it is the reason a single chart is never the whole picture.
Putting It Together Before a Trade
A practical reading order, from the chart to the decision.
Check the sign, then the age of the run. You are looking for a regime, not a number.
Convert to a common period. Nothing compares until this is done.
Check whether the series is near a cap. Flat tops are walls.
Compare at least two venues. Our snapshot shows why one is not enough.
Separate settled from predicted. Only the settled part is history.
Then look at depth and your own costs, neither of which is on the chart.
Doing that across several venues, several times a day, is the part that does not scale by hand. Pocketfolio’s DIY Trading Scanner, a crypto funding rate arbitrage scanner covering 50+ venues, puts normalised rates and their history in one view so the comparison above takes a glance rather than an afternoon.
It does not remove the costs in this guide, and it does not make the chart predictive. It removes the conversion step and the tab switching.
Reading History for the Spread, Not the Rate
Everything above reads one venue’s chart. For crypto funding rate arbitrage that is the wrong object to be looking at.
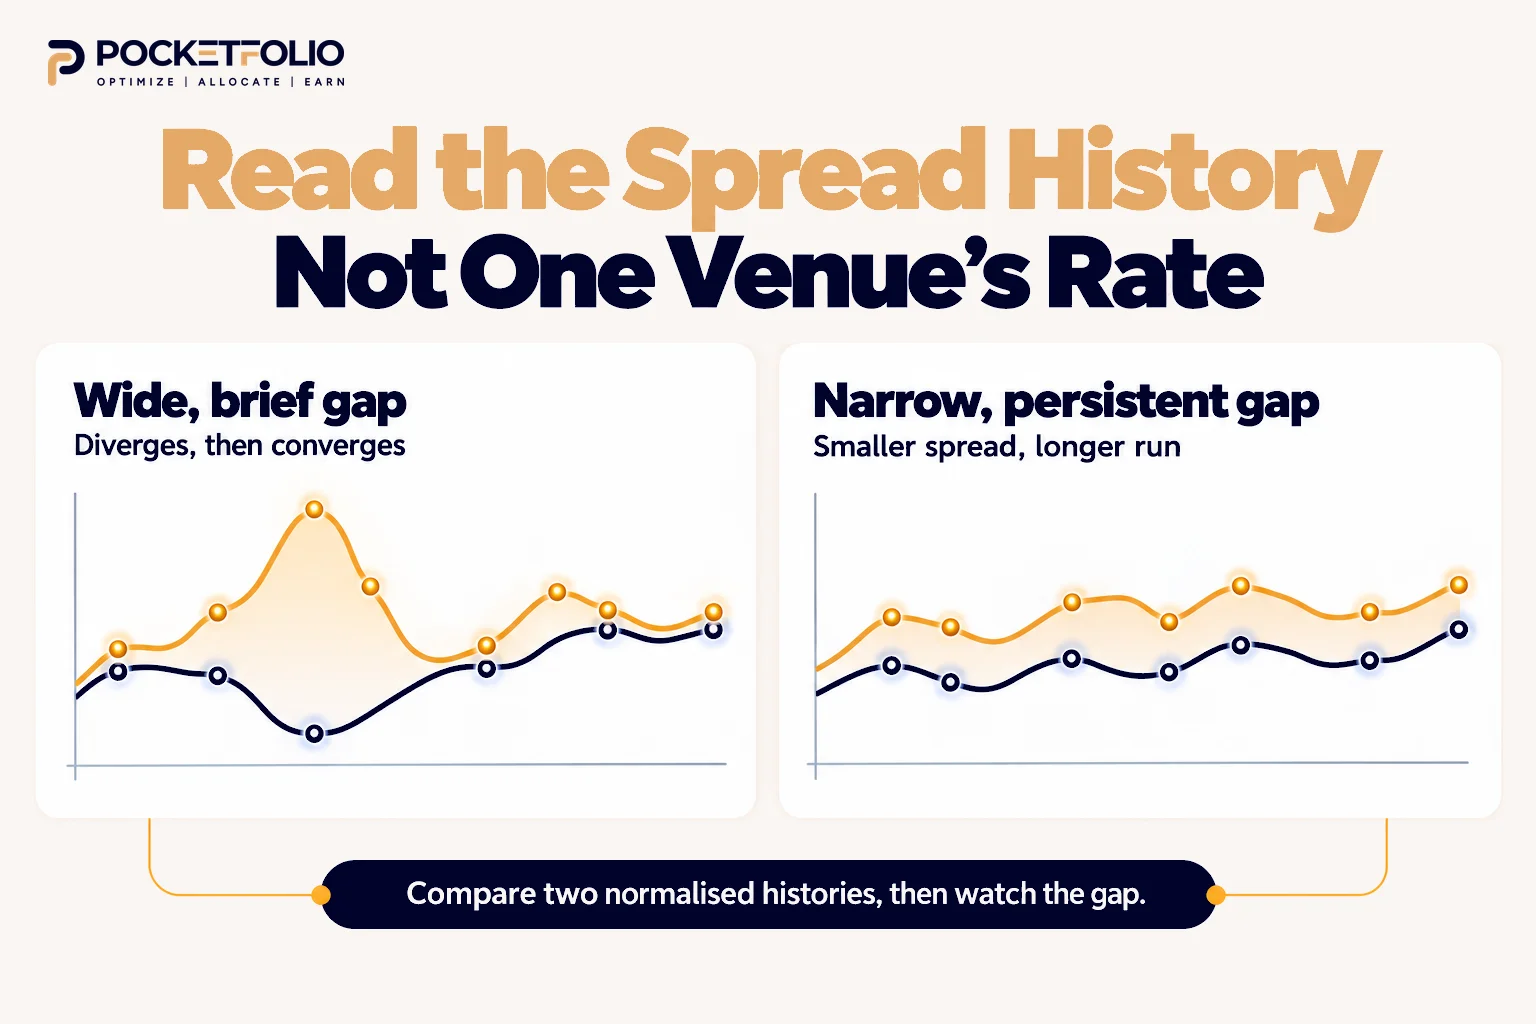
The trade does not live in one venue’s rate. It lives in the gap between two, and that gap has its own history which no single chart shows.
A wide gap today says nothing about whether it persists. Two venues can diverge for an afternoon and converge by the next settlement, which is not long enough to clear your costs.
A narrow but stable gap can beat a wide unstable one. The same logic as persistence beating level, applied one layer up.
Gaps close as people find them. A spread visible on a public chart is visible to everyone, so the useful question is how long this pair has historically taken to converge.
Our snapshot makes the point concrete. Bybit USDT and Binance USDT disagreed on the sign of the same asset at the same moment, which is a gap you could only see by holding both charts side by side.
Why this is hard by hand
Tracking one venue’s history is reading a chart. Tracking the gap between two is reading two charts and subtracting, after converting both to the same period.
The work grows with the square of the venues you follow, not in a straight line. Three venues is three pairs, and six venues is fifteen.
That is why spread history is the part people skip, and why the trades that survive longest tend to be found by whoever was actually watching the pair rather than the headline rate.
Mistakes People Make Reading Funding History
Reading the level before the sign. The sign decides the trade shape; the level only decides whether it is worth it.
Comparing unnormalised charts. An hourly series and an eight hour series are different units.
Treating the newest point as settled. It is often a live estimate that has not frozen yet.
Assuming the sign is always positive. Our snapshot found Bitcoin negative on two major venues on one ordinary day.
Reading one venue and calling it the market. Venues disagreed on the sign in that same snapshot.
Mistaking a capped rate for a strong one. A flat top is a ceiling, not momentum.
Using an average across a jagged series. The average hides exactly the troughs you would have had to sit through.
Assuming a long run predicts a longer one. Persistence is evidence about the past and nothing more.
Frequently Asked Questions
What should I look at first on a crypto funding rate history chart?
The sign, then how long it has held. The level matters less than whether the regime is stable enough to hold a position through.
How long does a rate need to hold before it is worth trading?
Long enough to clear your entry and exit costs, which takes more settlements than most people expect. A spike that disappears before break-even was never an opportunity.
What does it mean when the chart is flat at the top?
The rate is sitting at the venue's cap and cannot climb further. On some venues hitting that ceiling also switches the contract to faster settlement.
Why do two exchanges show different history for the same coin?
Each venue sets its rate from its own order book and premium index, so genuine differences are normal. Part of the gap can also be an illusion from different settlement periods, which is why conversion comes first.
Is the last point on the chart the real rate?
Often not, because many pages show a live predicted estimate alongside settled history. Only the settled figures record what actually changed hands.
Can a funding rate history chart predict future rates?
No. It describes regimes that have happened, which is useful for judging stability and useless as a forecast.
How far back should I look?
Far enough to see several sign changes, so you can judge typical run length rather than guessing from the current one.
Do negative funding rates show up often?
Often enough to matter. A cross-venue snapshot taken on an ordinary day in October 2026 found Bitcoin negative on two major venues while positive on most others.
What does the chart not show me?
Order book depth, your own trading costs, and the other venue in your spread. None of those appear on a single chart and all of them decide whether a trade works.
How many venues should I compare?
At least two, and more once you are hunting spreads for crypto funding rate arbitrage, because the trade lives in the gap between venues rather than inside one chart.
Sources and Methodology
The cross-venue snapshot was captured on 6 October 2026 from Coinalyze, which renders its funding table server-side, with all rates normalised to an 8 hour period as that source states.
It was cross-checked the same day against a second independent aggregator.
Bitcoin on Binance read slightly negative in both, at -0.0015% and -0.0020% respectively, captured minutes apart. Direction and magnitude agree across the two sources.
The cross-asset figures, TRX near -0.04% across several venues and Monero at +0.10%, come from that second source on the same day.
This is a snapshot of one moment, not an average and not a forecast. It is included to demonstrate a pattern, specifically that venues disagree on the sign of the same asset at the same time. Treat every figure in it as a dated observation that has since changed.
The 0.01% per 8 hour baseline referenced in the snapshot discussion matches the interest rate component documented across Binance, OKX and Hyperliquid, cross-verified across all three.
No figure in this guide is a Pocketfolio rate, yield, return or product metric. Every number is published exchange or aggregator data, attributed and dated.
Other published studies of funding history exist, including aggregate analyses across multi-year datasets. Their figures are their own work and are not restated here; this guide uses its own two readings instead.