Most explanations of why crypto funding rate arbitrage trades lose money give you a list. Funding reversal, liquidation, slippage, transfer delays, counterparty failure, and so on down the page.
The list is accurate and close to useless, because it tells you nothing about which item is actually emptying your account.
So we measured it, across the 60 most liquid Bybit perpetuals.
That gave 12,000 historical funding settlements, a median of 66 days each, and a count of how often each loss mode was live.
The answer is not the one the field leads with.
The Short Answer, Ranked by How Often It Happens
Three measured modes, in order of frequency rather than drama.
The rate decays below the point where it covers your costs. 58.0% of settlements printed at or below the funding formula’s own baseline. This is the most common way the trade fails and almost nobody writes about it.
The rate turns against you. 19.3% of settlements were negative, so roughly one in five, which means you paid instead of collecting.
The rate will not hold still long enough to pay for the position. The median contract changed sign every 1.18 days while needing 18.3 days to cover its round trip. So the rate flipped about fifteen times before the trade broke even.
Two competitors we read name reversal as the largest or most common risk. Measured, reversal is less than a third as frequent as quiet decay.
Why Frequency Is the Right Unit
A risk list treats every item as equally likely, which is how a reader ends up guarding against the dramatic failure and losing money to the boring one.
Liquidation is frightening and rare. A rate drifting from 0.02% to 0.008% is dull and happens constantly.
Both end with the position underwater, and only one of them gets written about. A delta neutral structure protects you from price direction, not from either of these. So the useful question is not what can go wrong but what usually does.
That requires measuring over time rather than at a moment. A snapshot tells you what rates are; only history tells you what happens to a position while you hold it.
What we measured and on what
The universe is the 60 Bybit linear perpetuals with 24 hour turnover above 5,000,000 USD. So this is the liquid end of the market rather than the long tail.
For each contract we pulled up to 200 historical funding settlements, a median of 66.3 days of history. We recorded where each settlement sat relative to the baseline and whether the sign had changed.
The liquid-end restriction matters and it runs in our favour. Thin contracts flip more, not less, so the figures here are the favourable end of the market rather than a worst case.
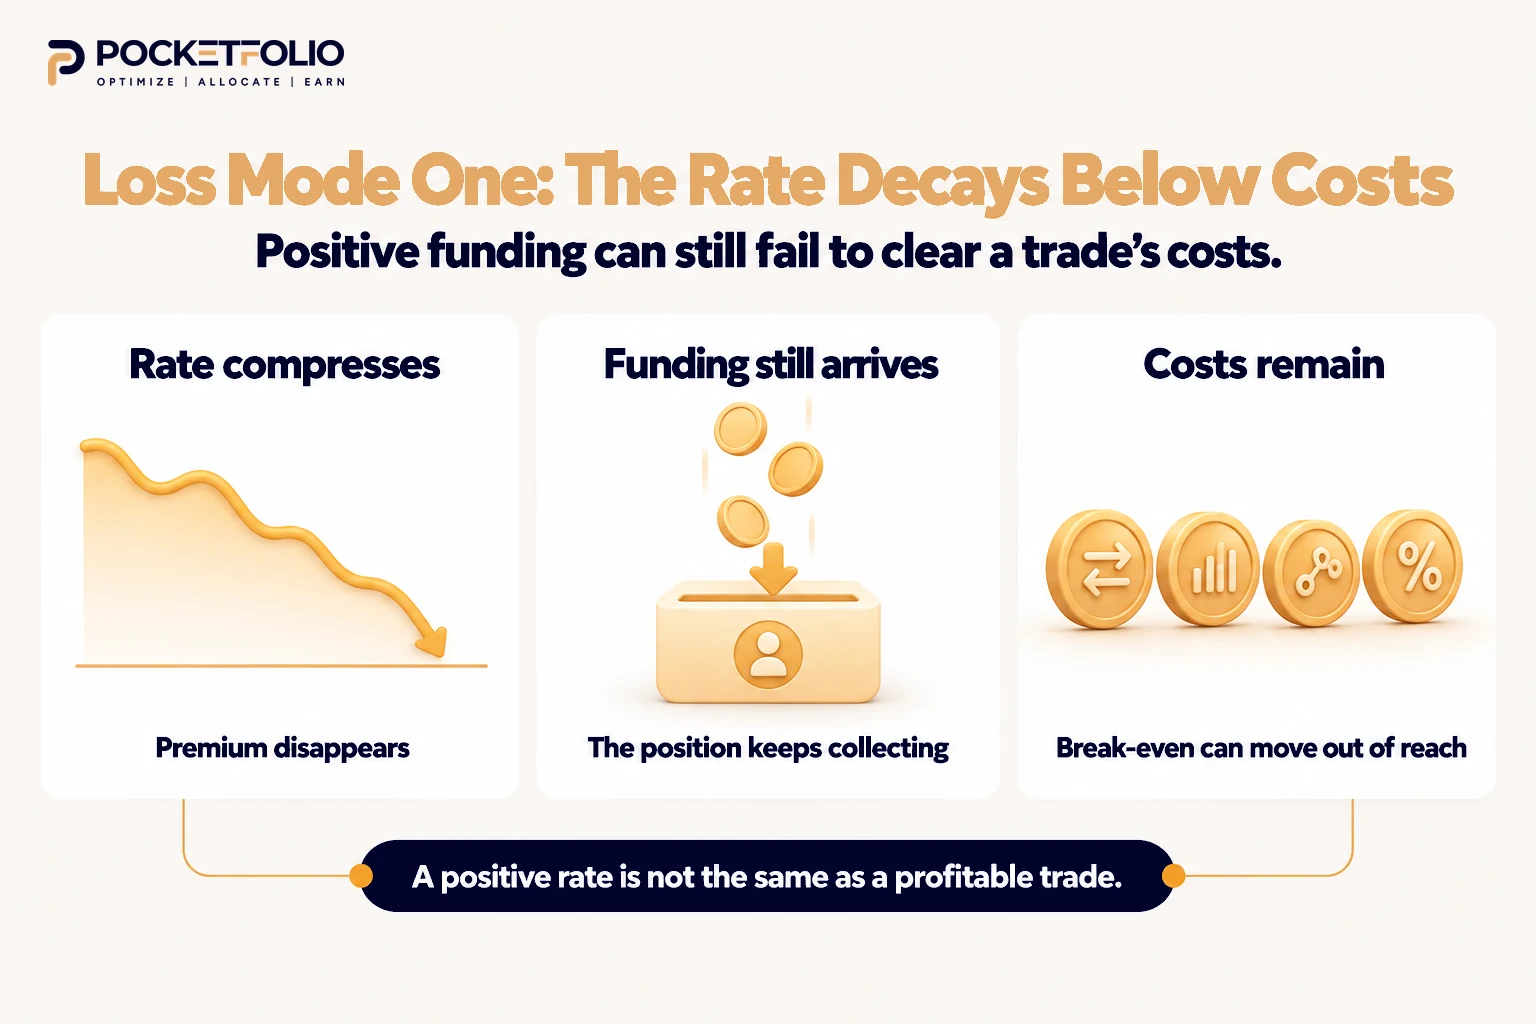
Loss Mode One: The Rate Decays Below Your Costs
This is the most common failure and the least discussed, which is a strange combination until you notice it makes for a dull headline.
The funding formula carries a fixed interest rate component, commonly 0.01% per 8 hours. While the premium index sits inside a narrow band, the finished rate prints at exactly that figure.
So the baseline is what the rate shows when nothing is happening. It is a floor, not an opportunity, and a contract sitting there has no premium left to harvest.
Across our sample, 58.0% of all settlements printed at or below that baseline.
The majors are the worst offenders
This is where it gets uncomfortable for anyone who trades only the large pairs.
BTCUSDT sat at or below the baseline in 89.5% of its settlements. ETHUSDT managed 85.5%.
So the two most liquid contracts on the venue almost never offered a premium worth collecting. That is consistent with both sitting below the baseline outright at an earlier capture.
Decay does not feel like a loss while it happens. The position is still collecting, the rate is still positive, and the account still ticks up, which is why people hold through it rather than closing.
Our guide to crypto funding rate caps sets out how the baseline, the clamp and the cap differ, since the three are routinely confused.
The majors had no premium at all
We checked five crypto contracts settlement by settlement, and the result is sharper than the
averages suggest.
| Contract | Settlements | Above the baseline | Negative | Printed exactly at the baseline |
|---|---|---|---|---|
| BTCUSDT | 200 | 0 | 21 | 14 |
| ETHUSDT | 200 | 0 | 29 | 16 |
| SOLUSDT | 200 | 0 | 83 | 43 |
| XRPUSDT | 200 | 0 | 57 | 52 |
| ZECUSDT | 200 | 0 | 14 | 141 |
Not one settlement out of a thousand printed above the baseline. Every positive settlement
on all five contracts sat at or below the interest rate component.
ZECUSDT printed the baseline exactly in 141 of its 200 settlements, so it was pinned to the
floor for 70% of the period.
Where the premium actually was
Across all 60 contracts, roughly 23% of settlements did print above the baseline, so the
premium existed somewhere. It was not in the crypto majors.
The one contract in our detail sample with real premium was SOXLUSDT, a tokenised equity perpetual. It printed above the baseline in 26% of its settlements and flipped sign only nine times.
So the premium in this market was concentrated in contracts that are not crypto pairs.
That is a finding about where to look rather than a recommendation. Tokenised equity perpetuals are a different product class with their own conventions and risks.
Our guide to the best exchanges for crypto funding rate arbitrage covers which venues list what. Contract availability decides whether this is even a choice you have.
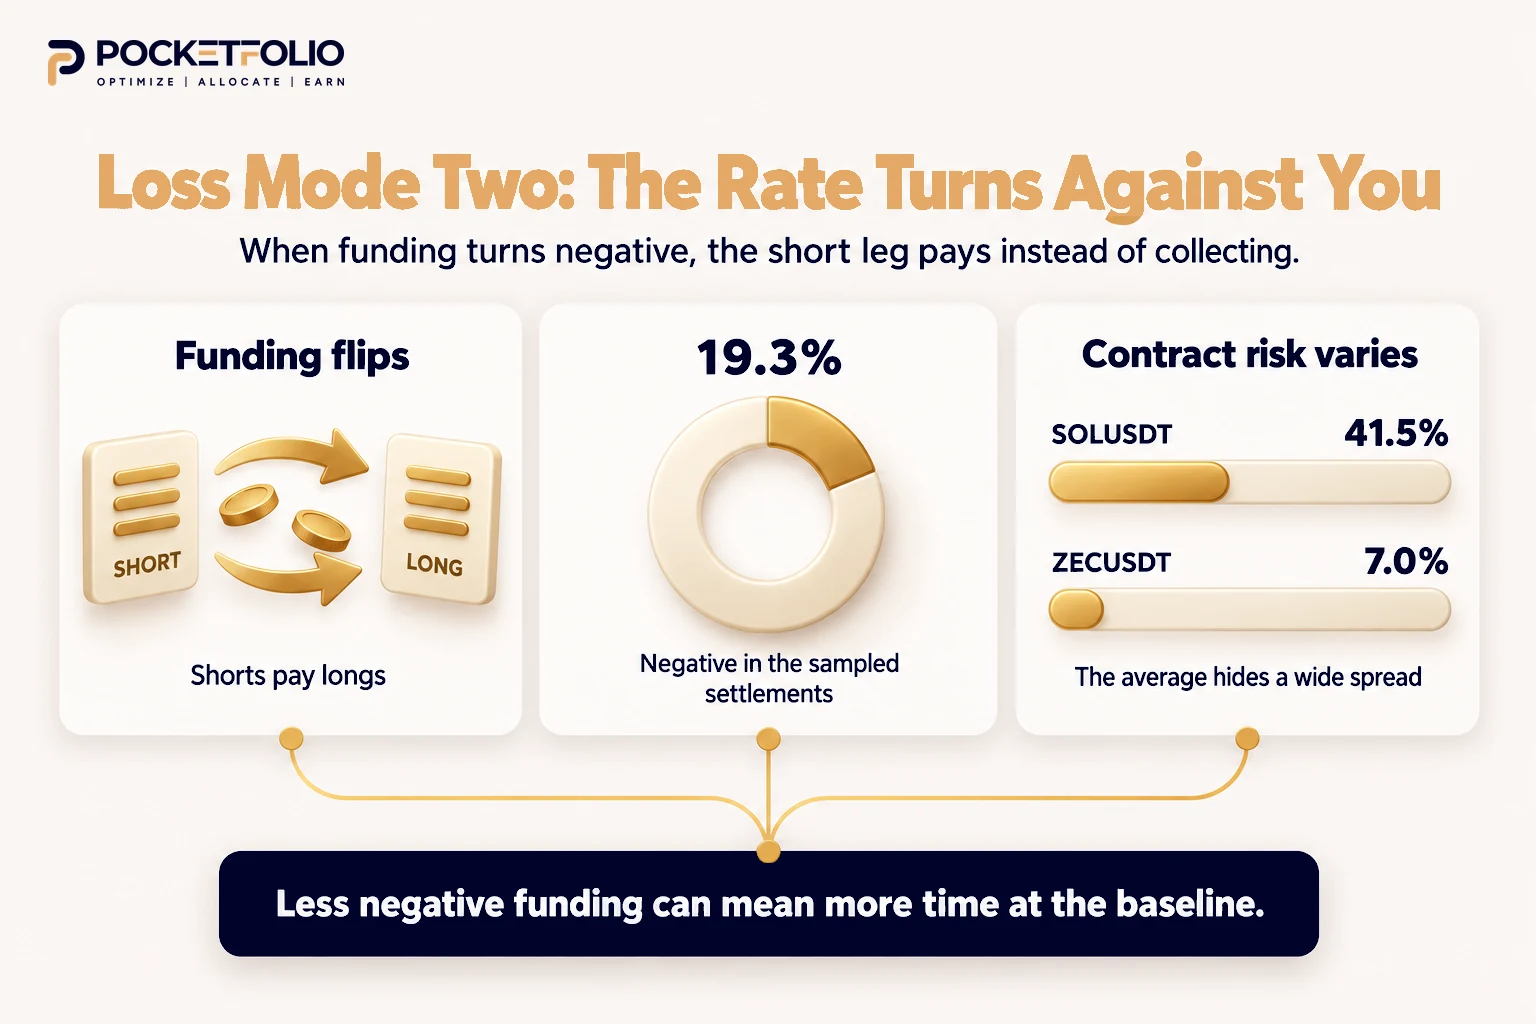
Loss Mode Two: The Rate Turns Against You
This is the one the field leads with, and it is real. It is just not the most common.
Negative funding means shorts pay longs rather than the reverse, so the leg that was earning starts costing. 19.3% of settlements in our sample were negative.
Roughly one settlement in five, you were paying to hold a position you opened to get paid.
How bad it gets depends entirely on the contract
The spread across contracts is wider than the average suggests.
| Contract | Negative settlements | At or below baseline |
|---|---|---|
| SOLUSDT | 41.5% | 58.5% |
| XRPUSDT | 28.5% | 71.5% |
| HYPEUSDT | 27.0% | 73.0% |
| 1000PEPEUSDT | 20.5% | 79.5% |
| ETHUSDT | 14.5% | 85.5% |
| BTCUSDT | 10.5% | 89.5% |
| ZECUSDT | 7.0% | 93.0% |
SOLUSDT was negative in over 40% of its settlements. A position there spent nearly half its life as a cost rather than an income.
Note what the table does to the usual advice. The contracts least likely to go negative are the ones most likely to sit at the baseline, so avoiding one mode walks you into the other.
Our guide to crypto funding rate arbitrage in a bear market covers the regime where negative funding stops being occasional.
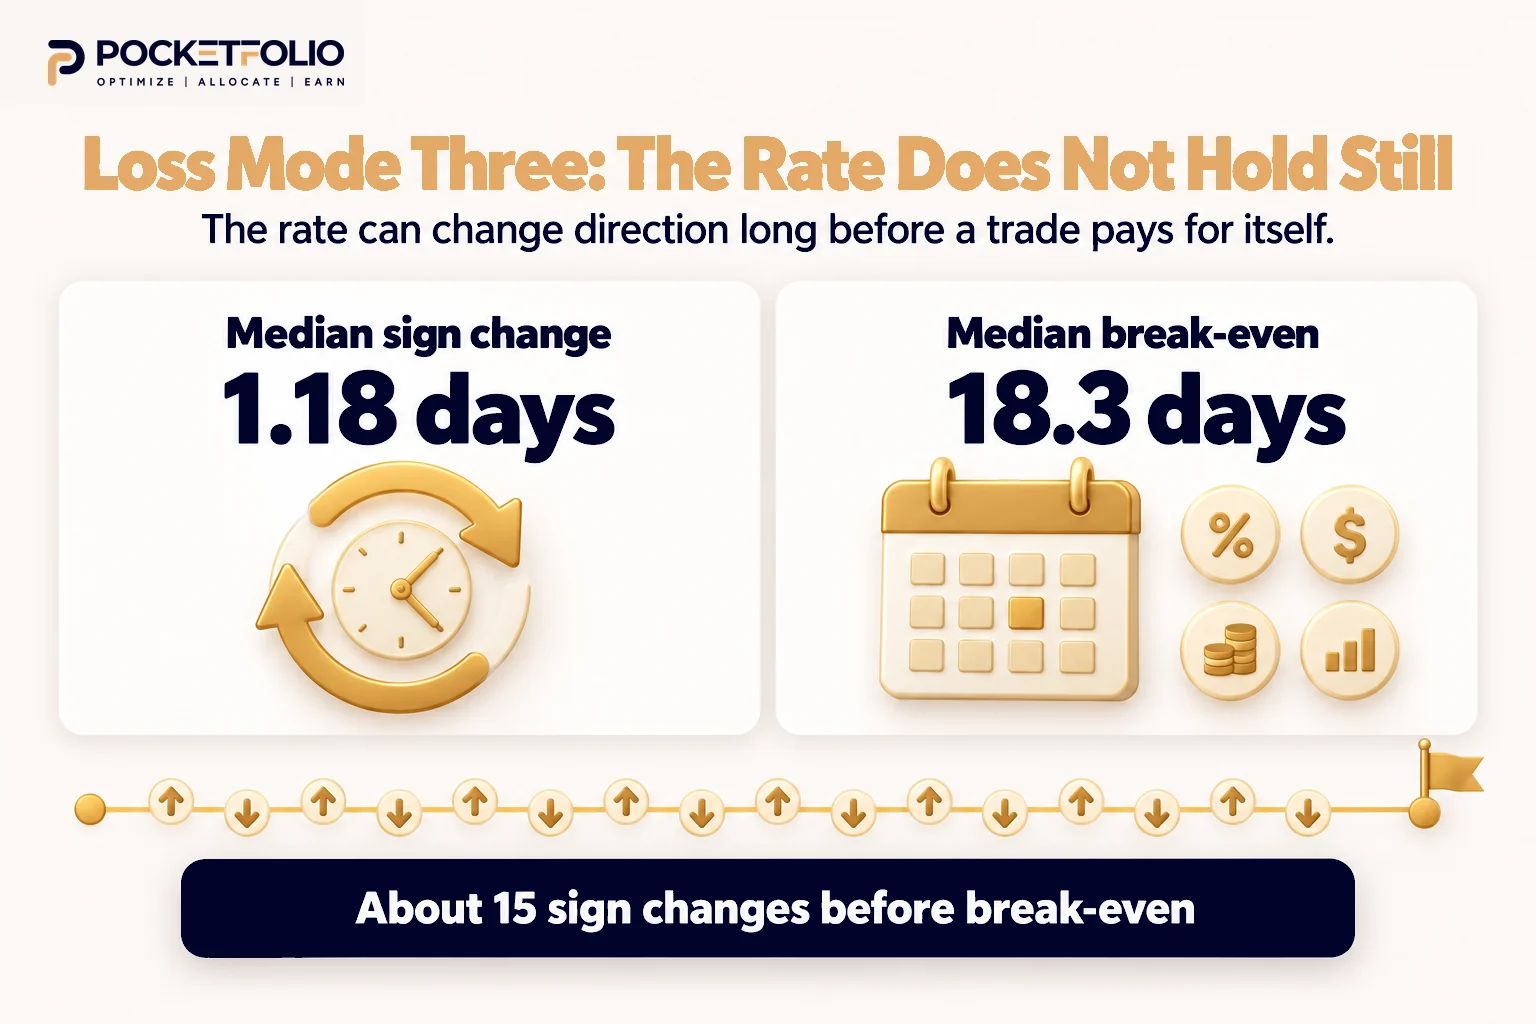
Loss Mode Three: The Rate Does Not Hold Still
Here is the measurement that explains the other two, and it is the part no competitor publishes.
We counted sign changes between consecutive settlements across the whole sample. 2,251 of them, across 60 contracts.
The median contract changed sign every 1.18 days.
Set that against what break-even takes
Using each contract’s own mean rate across the period, against a 0.24% maker round trip over four fills, the median contract needed 18.3 days to cover opening and closing.
So the arithmetic is: a rate that changes direction every 1.18 days, against a position that needs 18.3 days to pay for itself.
The rate flipped sign roughly fifteen times before the trade broke even.
That is the mechanism behind every loss mode above. The rate you entered on is not the rate that pays your fees, because it does not survive long enough to.
The worst and the best cases in the sample
SOLUSDT changed sign every 0.86 days while needing 44.5 days at its mean rate. It was being repriced against the holder roughly fifty times inside a single break-even window.
BTCUSDT was the steadier case at 2.37 days per flip and 18.3 days to clear, which still means about eight sign changes before the position covered its costs.
Three contracts never flipped at all: gold, crude oil and a tokenised equity. All three are commodity or equity perpetuals where positioning stays one-sided rather than crypto pairs, so they are the exception that shows the rule rather than a recommendation.
Two Break-Even Figures, and Why We Are Publishing Both
We have given a different number before, and the difference is the whole argument rather than an error to bury.
An earlier guide measured the median break-even at 8 days, computed from each contract’s funding rate at a single moment.
This measurement gives 18.3 days, computed from each contract’s mean rate across 66 days.
Both are correct for what they measure. The snapshot version assumes the rate at entry persists, and the historical version does not.
Since the rate changes sign every 1.18 days, the assumption behind the shorter figure is exactly the one this guide exists to test. Plan against 18.3 days, not 8.
Our guide to whether crypto funding rate arbitrage is still profitable carries the band census the 8 day figure came from. It remains the right measurement of the market at a moment.
The Loss Modes We Did Not Measure
An honest frequency ranking has to say what is missing from it, or the ranking implies the unmeasured modes are rare.
Liquidation of the short leg. A sharp move against the perpetual can close it before the hedge is unwound, leaving the spot side exposed. We did not measure how often this happens and it cannot be read from funding history.
Slippage on entry and exit. Every hold figure here uses a clean maker fee with no slippage. Real fills are worse, so every break-even figure in this guide is optimistic.
Basis risk. The spot and perpetual prices can diverge by more than the funding income, particularly in a cross-exchange structure.
Transfer friction and stranded capital. Moving funds between venues takes time and costs a fee, and the window you were moving into can close.
Counterparty failure. A venue freezing withdrawals leaves both legs where you cannot reach them.
Those are real and some are severe. Their absence from the ranking reflects what funding history can show, not a judgement that they do not matter. Our guide to 5 common mistakes in crypto funding rate arbitrage covers the behavioural side of several of them.
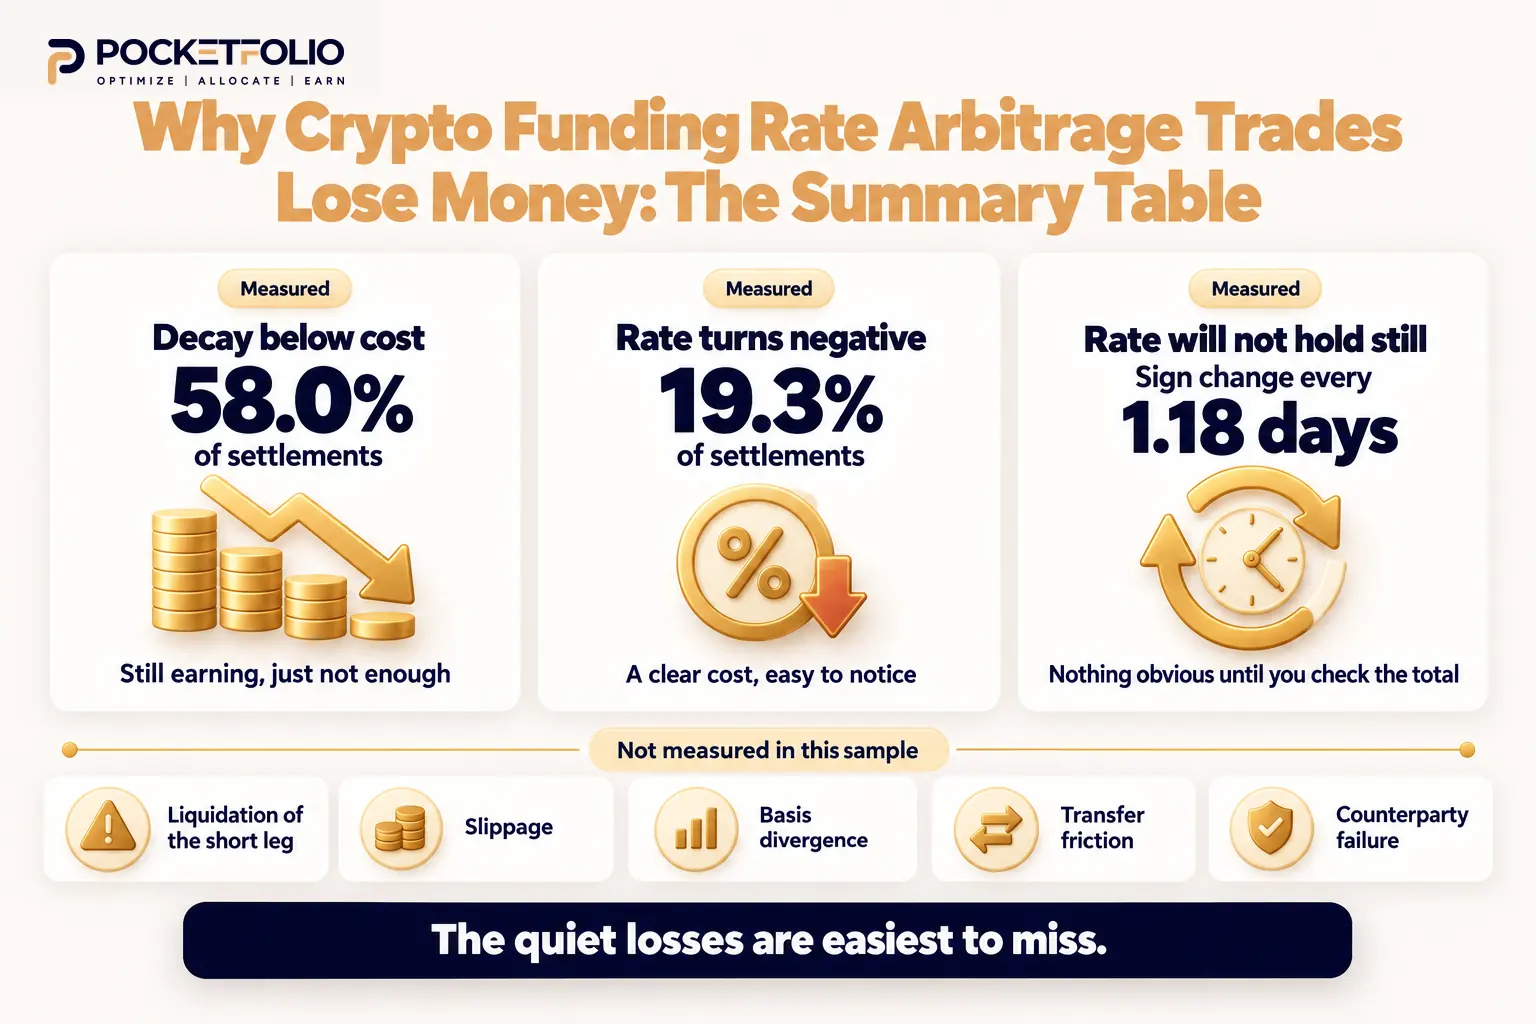
Why Crypto Funding Rate Arbitrage Trades Lose Money: The Summary Table
Everything above in one place, with what each mode looks like while it is happening.
| Loss mode | How often it was live | What it feels like at the time | Measured |
|---|---|---|---|
| Decay below cost | 58.0% of settlements | The position is still earning, just not enough | Yes |
| Rate turns negative | 19.3% of settlements | A clear cost, easy to notice | Yes |
| Rate will not hold still | Sign change every 1.18 days | Nothing in particular, until you check the total | Yes |
| Liquidation of the short leg | Not measured | Sudden and severe | No |
| Slippage | Not measured | Invisible, priced into every fill | No |
| Basis divergence | Not measured | Gradual, then not | No |
| Transfer friction | Not measured | A missed window | No |
| Counterparty failure | Not measured | Total, and out of your hands | No |
Read the third column. The two most frequent modes are the two that feel like nothing while they drain the position, which is why the dramatic ones get the coverage.
What to Actually Do About It
The measurement points to a few specific changes rather than general caution.
Judge a contract on its history, not its current rate. A rate that changes sign every day or so tells you almost nothing about the next two weeks, and the current reading is the single weakest predictor available.
Plan for the longer break-even. If the honest figure is closer to 18 days than 8, the position needs to survive a fortnight of repricing rather than a week.
Treat the baseline as a stop, not a floor. A contract sitting at the interest rate component has nothing left to harvest, and waiting for it to recover is holding risk for no income.
Check how often your pair has gone negative, not whether it is negative now. SOLUSDT at 41.5% and BTCUSDT at 10.5% are different propositions regardless of what either prints today.
Decide the exit before the rate moves. Our guide to when to close a crypto funding rate arbitrage position explains why the threshold for holding sits below the one that justified opening.
Count your fills. Four fills at a maker fee is roughly 0.24% of notional, and at taker fees it is closer to 0.31%, which lengthens every break-even figure above. The full cost stack is in our guide to how to make money with crypto funding rate arbitrage.
Where Pocketfolio Fits
The measurement says the current rate is a poor guide and the history is the useful one, which is a monitoring problem rather than a judgement problem.
Checking the sign-change frequency and baseline share for every candidate contract across several venues is not something anyone does by hand. The set worth watching also moves between settlements.
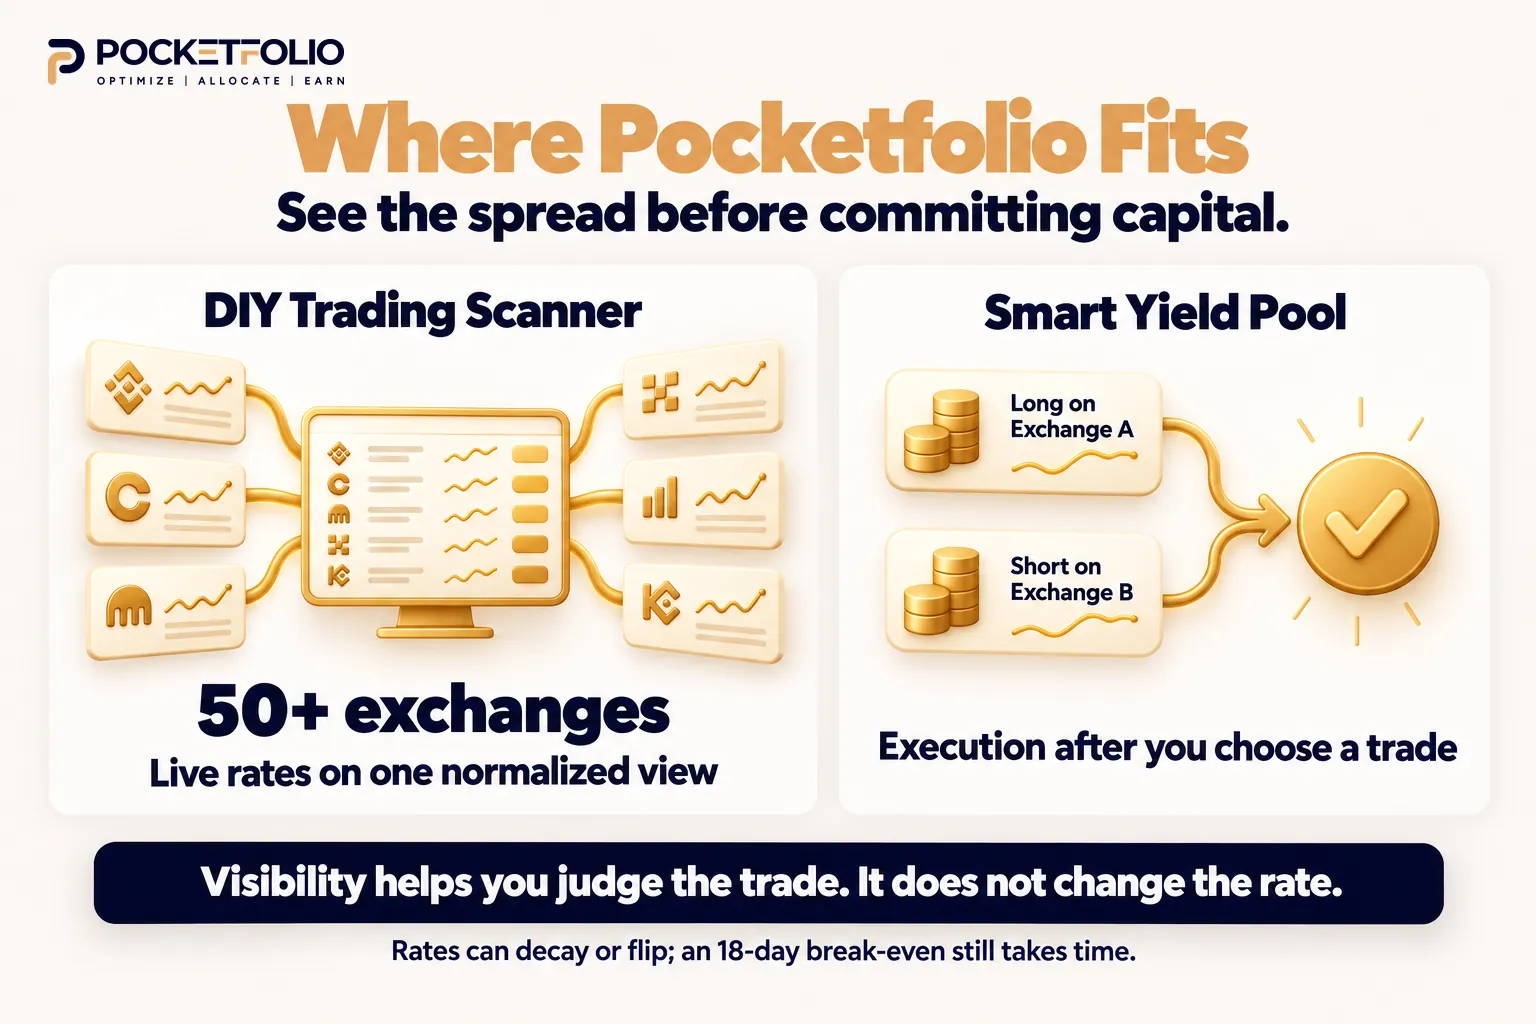
Pocketfolio’s DIY Trading Scanner, a crypto funding rate arbitrage scanner covering 50+ exchanges, puts live funding rates in one normalised view.
Against the findings above, the useful part is seeing the spread across venues at once rather than reading a single number and assuming it will hold.
The Smart Yield Pool handles execution once you have judged a trade worth taking.
Neither fixes what this guide measures. A scanner cannot stop a rate decaying to the baseline, cannot stop it changing sign every day, and does not shorten an 18 day break-even.
What it removes is the part that made these losses invisible: having no view of what a rate has been doing before you commit.
Frequently Asked Questions
Why do crypto funding rate arbitrage trades lose money most often?
Decay rather than reversal. In our sample 58.0% of settlements printed at or below the funding formula's baseline, against 19.3% that were negative.
Is funding rate reversal the biggest risk?
It is the most discussed, not the most frequent. Two guides we read call it the largest or most common risk, while our measurement puts it at less than a third the frequency of quiet decay.
How often does a funding rate change sign?
The median contract in our sample changed sign every 1.18 days, with 2,251 sign changes counted across 60 contracts and 12,000 settlements.
How long does a position take to break even?
About 18.3 days at each contract's mean rate over 66 days, against a 0.24% maker round trip. That is longer than a single-moment measurement suggests, because the entry rate does not persist.
Which contracts lose money most often?
In our sample SOLUSDT was negative in 41.5% of settlements and changed sign every 0.86 days. The quieter majors trade that risk for a different one, sitting at or below the baseline in roughly 85 to 90% of settlements.
Does trading only Bitcoin avoid the problem?
No, it changes which problem you have. BTCUSDT went negative in only 10.5% of settlements but sat at or below the baseline in 89.5% of them.
Why is the current funding rate a poor guide?
Because it changes sign roughly every day while a position needs about two and a half weeks to cover its fees. The reading at entry has little bearing on the period you are exposed to.
Do these figures include slippage and liquidation?
No. Every break-even figure here uses a clean maker fee, and liquidation cannot be read from funding history, so the measured modes understate total losses.
Is a low funding rate the same as a loss?
Not immediately, but a rate below the level that clears your round trip means the position is not yet profitable and may never be. That is the distinction the baseline marks.
Does a longer settlement interval reduce the risk?
It does not change the daily cost, since the rate is divided for the shorter period. Fewer settlements mean fewer moments of exposure, which is a timing difference rather than a cost one.
Sources and Methodology
Funding history was read first-hand from Bybit's public endpoints on 30 October 2026, at 05:26 and 05:30 UTC. We pulled up to 200 historical settlements for each of the 60 linear perpetuals with 24 hour turnover above 5,000,000 USD.
That gave 12,000 settlements and a median of 66.3 days of history per contract.
For each settlement we recorded the rate's position relative to the 0.01% per 8 hours interest rate component and whether the sign had changed from the previous settlement. Sign changes were counted only between two non-zero settlements.
The break-even figures are our own arithmetic. Each contract's mean rate across the period was converted to a daily figure using that contract's own settlement interval, read per contract rather than assumed. That daily figure was then divided into a 0.24% round trip, derived from Bybit's published VIP 0 schedule over four fills.
What this measurement cannot establish
One venue. Bybit only. An earlier capture cross-checked band shares against Binance and agreed closely, but the sign-change count was not repeated there.
The liquid end only. The turnover floor excludes the long tail, where contracts flip more often rather than less, so these figures are the favourable end of the market.
Up to 200 settlements per contract, which is the endpoint's page size rather than a chosen window. The span therefore differs by contract according to its settlement interval.
Slippage, liquidation, basis divergence, transfer friction and counterparty failure were not measured and are named as unmeasured in the body rather than omitted.
On the revised break-even figure
An earlier guide in this cluster published a median break-even of 8 days from a single-moment capture. This guide publishes 18.3 days from mean rates over 66 days.
The second supersedes the first as an answer to how long a position takes in practice, while the earlier figure remains correct as a measurement of the market at that instant.
We are publishing both rather than quietly replacing one.
How the competitive claim was scoped
The statement that no competing guide ranks loss causes by measured frequency refers to the five guides read in full for this article. It is not a claim about the whole field, and a sixth could not be retrieved.
One competitor does publish a frequency figure, citing CoinGlass data that BTC funding on Binance was negative roughly 20 to 25% of 2022 to 2023. That is one asset on one venue over one period and is attributed to that guide rather than verified by us.
No figure in this guide is a Pocketfolio rate, yield, return or product metric, and no return or loss projection appears anywhere.