Pocketfolio Team
September 22, 2026

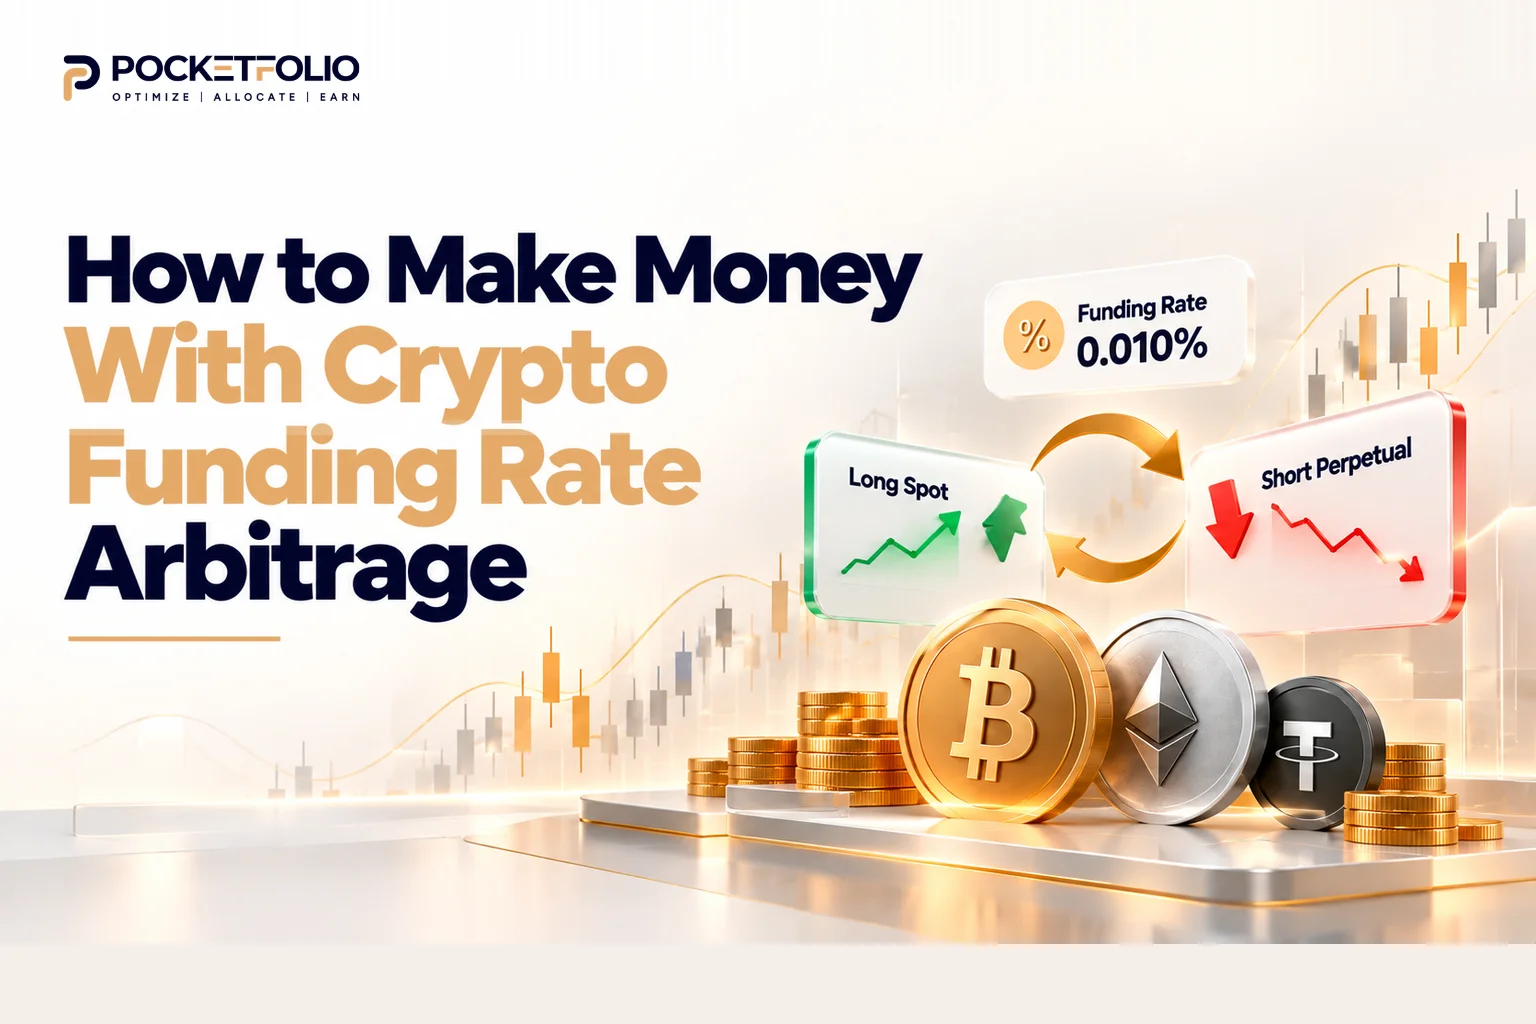
Most guides answer “how to make money with crypto funding rate arbitrage” with a yield range and a shrug. You will see 8%, 20%, sometimes 50%.
Those numbers are gross. They describe what the funding rate pays before anything is taken out.
What you actually keep depends on four things: the rate, how long you hold, what your venue charges, and whether your account is big enough to absorb the fixed costs.
The short answer: the rate sets your income, fees set your floor, and hold duration decides which one wins.
On a $10,000 position at a typical rate, a 30-day hold surrenders 38% of the gross yield to costs. A 365-day hold surrenders 3%.
This guide shows the arithmetic behind that, so you can run it on your own numbers instead of trusting a headline.
Crypto funding rate arbitrage pays you by holding two offsetting positions. You go long spot and short the perpetual future, or you run the same coin long on one venue and short on another.
The two legs cancel each other out on price. Whatever bitcoin does, you are flat.
What you are left holding is the funding payment. When the funding rate is positive, shorts get paid, so the short leg collects while the long leg sits there hedging you.
Your gross income is simple. It is the funding rate multiplied by your position size, paid at every settlement.
At 0.01% per 8 hours, that is 0.03% a day, which annualises to 10.95% before costs. Pocketfolio’s guide to how exchanges calculate funding rates covers where that percentage comes from.
Then the costs start.
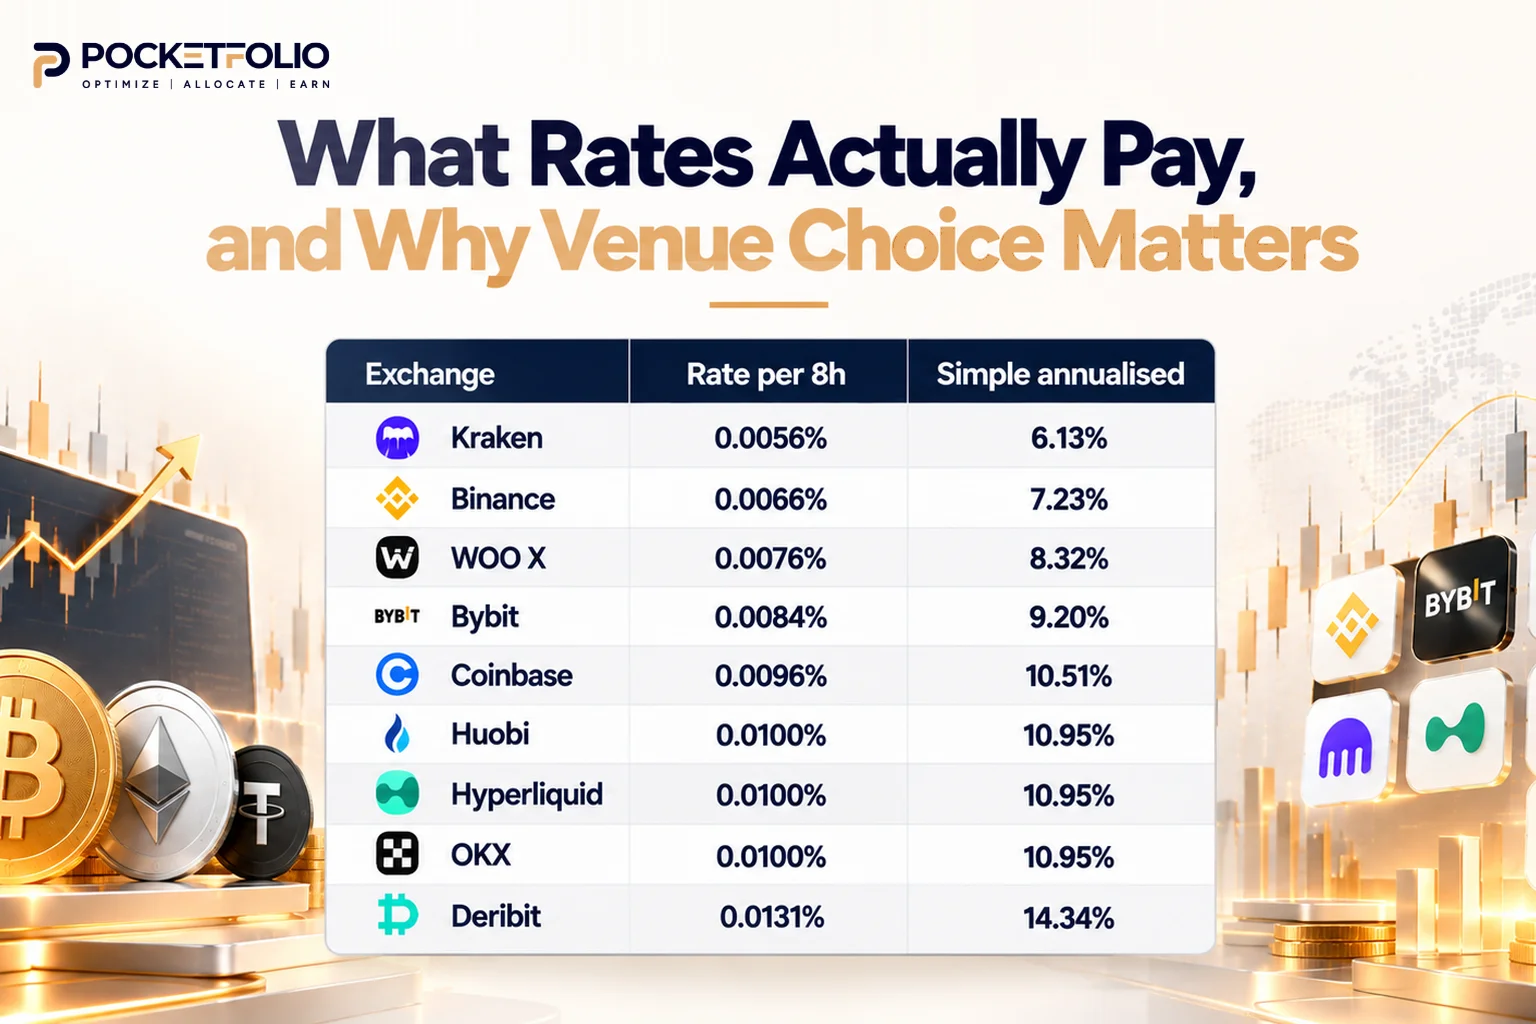
Abstract percentages are easy to argue with, so here are real ones.
This is BTC perpetual funding across nine venues, captured on 22 September 2026 and normalised to 8-hour intervals.
| Exchange | Rate per 8h | Simple annualised |
|---|---|---|
| Kraken | 0.0056% | 6.13% |
| Binance | 0.0066% | 7.23% |
| WOO X | 0.0076% | 8.32% |
| Bybit | 0.0084% | 9.20% |
| Coinbase | 0.0096% | 10.51% |
| Huobi | 0.0100% | 10.95% |
| Hyperliquid | 0.0100% | 10.95% |
| OKX | 0.0100% | 10.95% |
| Deribit | 0.0131% | 14.34% |
Two things are worth sitting with.
The first is that the 0.01% figure used throughout this guide is not a convenient invention. It is the median of what venues were actually paying, and an independent data source showed BTC 8-hour funding at exactly 0.0100% with an 11.0% annualised equivalent on the same day.
The second is the spread. The highest venue was paying 2.34 times the lowest, for the same asset, at the same moment.
On $50,000 held for 30 days, that gap is worth $337.50. Same coin, same strategy, same day, different venue.
That is the strongest argument in this entire guide for comparing venues before you commit. Pocketfolio’s DIY Trading Scanner covers 50+ exchanges for exactly this reason.
Treat the table as a dated snapshot rather than a forecast. Rates move constantly, and the point is the shape of the spread, not these particular numbers.
Here is the part the yield headlines leave out. Opening and closing this trade takes four fills, not two.
You pay to enter the spot leg and to enter the perpetual leg. Later you pay to exit both.
Bybit publishes its standard rates, so the maths is checkable. At VIP 0, spot costs 0.10% and USDT perpetuals cost 0.02% as a maker or 0.055% as a taker.
| Fill | Maker | Taker |
|---|---|---|
| Spot entry | 0.100% | 0.100% |
| Perpetual entry | 0.020% | 0.055% |
| Spot exit | 0.100% | 0.100% |
| Perpetual exit | 0.020% | 0.055% |
| Round trip total | 0.240% | 0.310% |
That 0.24% is your floor. You do not earn a cent until the funding you collect clears it.
Fee schedules change and vary by tier, so check your own venue’s live page rather than trusting any table, including this one.
This is also why venue choice is a rate question and a cost question at the same time. Pocketfolio’s DIY Trading Scanner covers 50+ exchanges precisely so the comparison is in front of you before you commit to one.
Divide the round trip cost by your daily funding income and you get the day you break even.
| Funding rate | Daily income | Days to clear a 0.24% round trip |
|---|---|---|
| 0.005% per 8h | 0.015% | 16.0 days |
| 0.010% per 8h | 0.030% | 8.0 days |
| 0.030% per 8h | 0.090% | 2.7 days |
This is why short holds fail. A trader who opens on Monday and closes on Thursday at a normal rate has paid 0.24% to collect roughly 0.09%.
They did not lose because the strategy is broken. They lost because they left before it started working.
There is no single number, because three different minimums are usually being confused with each other.
The exchange enforces one. Bybit’s BTCUSDT perpetual takes a minimum of 0.001 BTC or 100 USDT of notional, so a legal position costs roughly $200 across both legs.
Your margin setup enforces another. The same position can need anywhere from one to two times its notional in capital, depending on whether your account funds each leg separately or lets existing holdings act as collateral.
Then there is the minimum that actually matters: the point where funding income clears your costs. Trading fees are proportional, so they do not change your percentage return by account size. Fixed transfer costs do, and they are what make small accounts unworkable.
At $10 of round trip transfer costs and a 30-day hold, break-even sits near $1,515. Put both legs on one exchange and the transfers disappear, along with most of the minimum.
For the full arithmetic, including exchange minimums, both margin modes, and what to do if you are below the threshold, see how much capital you need to start crypto funding rate arbitrage.
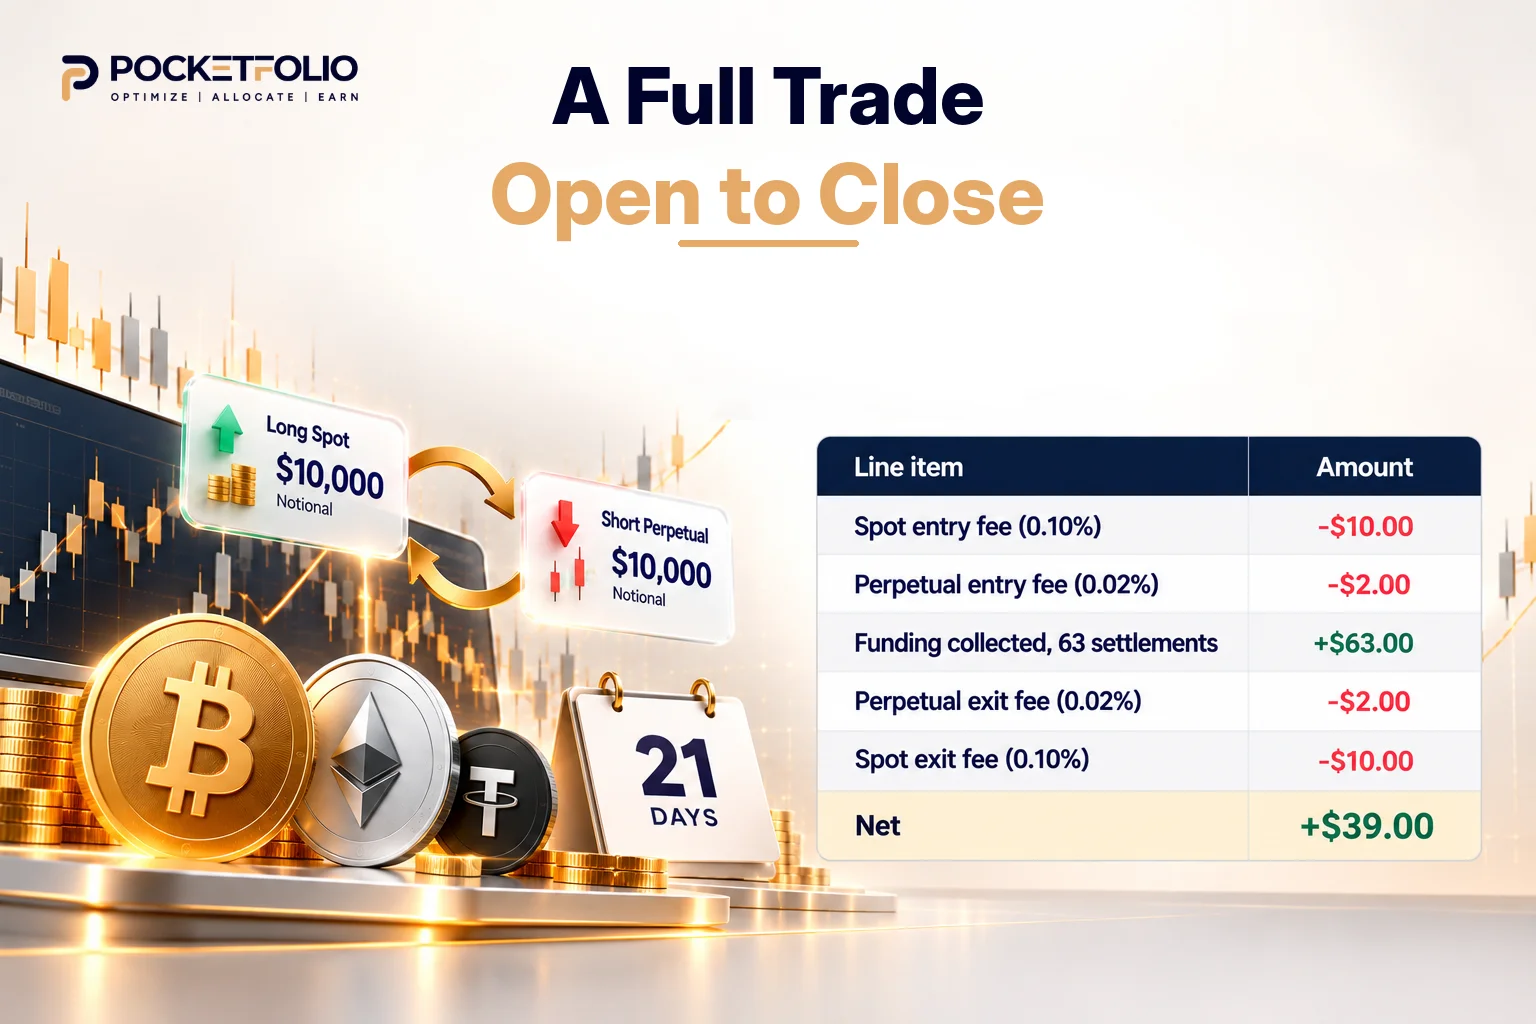
Here is every line item on one position, so nothing hides in a percentage.
You open $10,000 of notional: long spot, short the perpetual. The funding rate is 0.01% per 8 hours and you hold for 21 days.
All fills are maker fills on Bybit’s published rates.
| Line item | Amount |
|---|---|
| Spot entry fee (0.10%) | -$10.00 |
| Perpetual entry fee (0.02%) | -$2.00 |
| Funding collected, 63 settlements | +$63.00 |
| Perpetual exit fee (0.02%) | -$2.00 |
| Spot exit fee (0.10%) | -$10.00 |
| Net | +$39.00 |
Thirty-nine dollars on ten thousand, over three weeks. Annualised, that is 6.78%.
Two things stand out. The four fees total $24, which is 38% of everything the funding paid you.
And the spot leg costs five times what the perpetual leg costs. Most traders watch the perpetual because that is where the funding lives, but the expensive side is the one they ignore.
Every table so far assumes you get filled at the price you wanted. At small size you usually do.
At larger size you do not. The order book only holds so much at the top, and clearing through it moves your average price against you.
That is slippage, and it is the one cost that gets worse as your account grows.
| Slippage per fill | Total across 4 fills | All-in cost | Break-even at 0.01% |
|---|---|---|---|
| 0.00% | 0.00% | 0.24% | 8.0 days |
| 0.05% | 0.20% | 0.44% | 14.7 days |
| 0.10% | 0.40% | 0.64% | 21.3 days |
| 0.20% | 0.80% | 1.04% | 34.7 days |
A tenth of a percent of slippage per fill nearly triples your break-even clock. That is far more damaging than the difference between two venues’ fee schedules.
It also complicates the earlier point about account size. Fixed transfer costs punish small accounts, and slippage punishes large ones.
Somewhere in between sits a size where both are manageable, and where that sits depends entirely on the liquidity of the pair you trade.
Crypto funding rate arbitrage returns look very different gross and net, which is why quoted yield ranges are close to meaningless on their own.
Here is the same $10,000 position at 0.01% per 8 hours, held for different lengths.
| Holding period | Net APR | Share of gross yield lost to costs |
|---|---|---|
| Gross, before any costs | 10.95% | 0% |
| 30 days | 6.81% | 38% |
| 90 days | 9.57% | 13% |
| 365 days | 10.61% | 3% |
The rate never changed, and the position never changed. Only the holding period did.
That is the single biggest lever most traders ignore, and it costs them more than venue choice ever will.
Treat every figure above as arithmetic from stated assumptions, not a forecast. Funding rates move constantly, and a rate that holds for a month may not hold for a year.
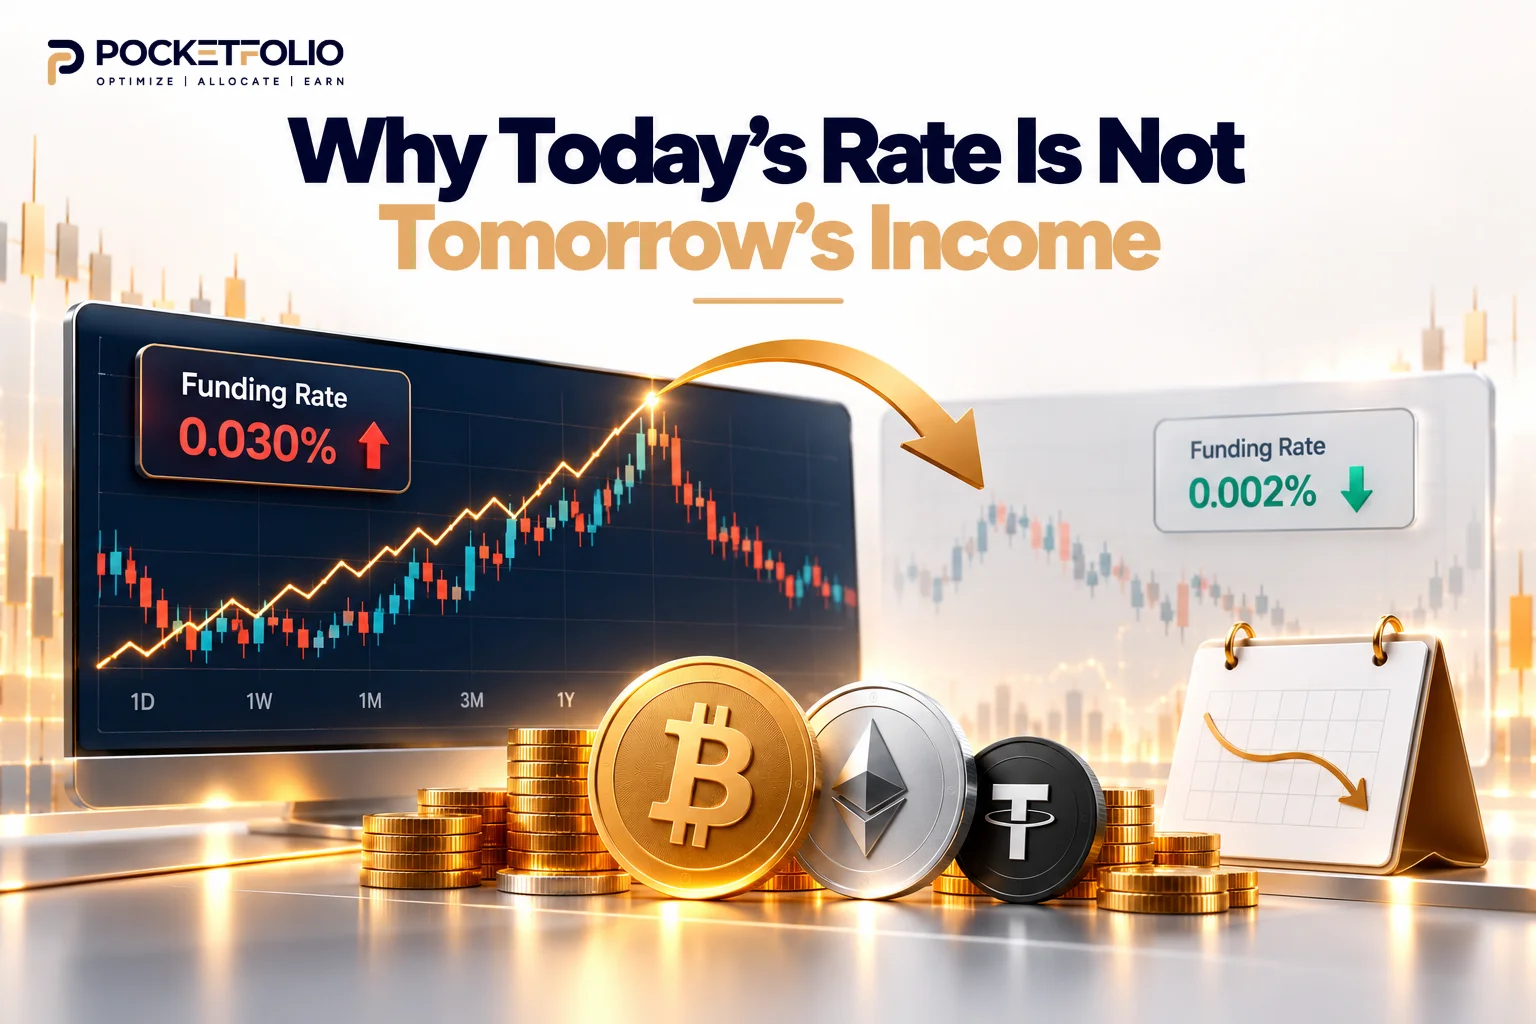
Every annualised number in this guide assumes a rate stays where it is. Real funding rates do not behave that way.
A rate spikes because positioning has gone one-sided, usually when a market is running hot. That imbalance is exactly what the funding payment exists to correct.
So the conditions that create a great rate are the same conditions that remove it. Why funding rates spike during bull runs covers that mechanism in detail.
The practical consequence is that a 30% annualised rate on your screen is not a 30% annual return. It is what you would earn if today repeated 365 times, which it will not.
Plan around the rate you can reasonably expect to persist for your holding period, not the one showing right now.
That is an argument for watching rates continuously rather than checking once. A live crypto funding rate arbitrage scanner like Pocketfolio’s DIY Trading Scanner keeps current rates across 50+ venues in one view instead of a screenshot that aged badly.
Annualising is what lets you hold a funding opportunity up against anything else you could do with the capital.
| Funding rate | Gross annualised | Net after 0.24%, 90-day hold |
|---|---|---|
| 0.005% per 8h | 5.48% | 4.50% |
| 0.010% per 8h | 10.95% | 9.98% |
| 0.030% per 8h | 32.85% | 31.88% |
Notice how little the 0.24% round trip matters once the holding period is long enough. Over 90 days it costs about a point of annualised return.
That is the same cost that wiped out a 3-day trade entirely. Nothing changed except time.
Compare those net figures against whatever else the capital could earn, including the risk attached to each. Pocketfolio’s comparison of funding rates against staking works through one such trade-off.
One cost is missing from every table here, and it is deliberate. Tax treatment varies by country and by how the income is classified, and it is not something a guide can compute for you.
Availability varies too. Which venues and products you can access depends on where you live, so check your local rules and your own tax position before sizing anything.
Everything above reduces to four things you control or watch.
The rate. It sets your income ceiling and decides how fast you clear costs. Higher rates shorten the break-even clock.
The holding period. Fixed entry and exit costs are spread across however long you stay. Leaving early is the most expensive mistake available.
Your venue’s fees. A 0.24% round trip and a 0.31% round trip are a 29% difference in cost. Maker fills over taker fills matter more than most traders think.
Your structure. Cross-exchange adds a fixed transfer toll that decides whether small accounts work. Same-exchange avoids it.
Notice what is not on that list. Nothing here is about predicting price, because the position is hedged.
Finding a good rate is the part worth automating. Pocketfolio’s DIY Trading Scanner, a crypto funding rate arbitrage scanner tracking live rates across 50+ exchanges, exists so you are comparing real current rates rather than yesterday’s screenshot.
All of this collapses into one check you can run in seconds.
Before opening, work out what the current rate would pay across your planned holding period. Compare that against your all-in cost: four fills, plus any transfer, plus expected slippage.
If the funding does not comfortably exceed the cost, the trade is not worth opening no matter how good the rate looks.
Pocketfolio’s pillar guide suggests a margin of safety here: only enter when expected funding is at least twice your total cost. That leaves room for the rate to soften while you are still in the position.
| Funding rate | Days to cover cost once | Days to cover it twice |
|---|---|---|
| 0.005% per 8h | 16.0 | 32.0 |
| 0.010% per 8h | 8.0 | 16.0 |
| 0.020% per 8h | 4.0 | 8.0 |
| 0.030% per 8h | 2.7 | 5.3 |
| 0.050% per 8h | 1.6 | 3.2 |
Those figures use a 0.24% all-in cost. Add your own slippage and transfer costs and every number moves right.
Read the table as a minimum commitment rather than a target. At 0.01%, you are agreeing to stay in for at least sixteen days before the trade has any real cushion.
Running that check needs a current rate, not yesterday’s. Pocketfolio’s DIY Trading Scanner is built to put live rates across 50+ exchanges in front of you at the moment you are deciding.
Funding arrives as cash, so you can withdraw it or put it back to work.
Reinvesting helps, but the effect is smaller than most people assume at these rates. On $10,000 held for a year at 0.01% per 8 hours, withdrawing as you go nets $1,071.
Reinvesting the funding daily nets $1,133 instead. That is $62 more, or roughly 0.62 percentage points.
Worth having, certainly. But it is a fraction of what you gain by simply holding long enough to spread your entry and exit costs.
Sequence matters here: get the holding period right first, then worry about compounding.
Holding discipline is easier when the position is not being managed by hand. Pocketfolio’s Smart Yield Pool automates execution, which removes one common reason traders close early.
Everything above is doable manually. Plenty of people run crypto funding rate arbitrage with a spreadsheet and two browser tabs.
What gets hard is the part this guide keeps returning to: knowing the current rate across venues at the moment you decide, and then staying in long enough for the arithmetic to work.
Pocketfolio builds two tools against exactly those two problems.
Finding the rate. The DIY Trading Scanner is a crypto funding rate arbitrage scanner tracking live funding rates across 50+ exchanges. It exists for the comparison step: which venue is paying what, right now, so the entry rule earlier in this guide has real numbers to work with.
Holding the position. The Smart Yield Pool automates the execution side once you have found a rate worth holding. That covers the mechanical part, which is where hand-run positions tend to go wrong.
Neither removes the costs in this guide. The four fills still cost what they cost, the break-even day is still the break-even day, and a rate that flips still flips.
What they change is how much of the work is manual, and how current your information is when you commit capital.
None of this arithmetic survives contact with a rate that flips. If funding turns negative while you are positioned to collect it, you start paying instead of earning.
Being delta neutral protects you from price direction. It does not protect you from anything else.
Liquidation risk is real on the short leg even in a hedged position, because the two legs sit in different margin systems. A sharp rally can force liquidation on the perpetual while your spot leg gains are stuck on another venue and cannot be used as margin in time.
Venue risk sits underneath all of it. Funding you have earned but not withdrawn is a balance on someone else’s platform.
Pocketfolio’s honest breakdown of crypto funding rate arbitrage risk covers what actually goes wrong, and how crypto funding rate arbitrage actually works covers the execution mechanics that protect you.
Gross crypto funding rate arbitrage returns are the funding rate times your position size, which at 0.01% per 8 hours annualises to 10.95% before costs. What you keep depends on your fees and how long you hold, and a 30-day hold at that rate nets closer to 6.8%.
It can be, but only past the break-even point. At a 0.24% round trip and a 0.01% rate you need about 8 days of funding just to cover the four fills.
Almost always because you closed too early. Collecting three days of funding at 0.03% a day earns 0.09% against a 0.24% round trip cost.
There is no universal minimum, because it depends on your fixed costs: at $10 of transfer costs and a 30-day hold, break-even sits near $1,515, while a same-exchange setup with no transfers has almost none. Bigger accounts do not earn a better percentage from trading fees, which are proportional, and win only where fixed costs are involved.
Yes. On Bybit’s published rates the round trip is 0.24% as a maker and 0.31% as a taker, so taker fills raise your cost by nearly a third and push your break-even day further out.
No. Rates move, positions need monitoring, and both legs need rebalancing if they drift apart, so treat it as an active strategy with a hedge rather than something you leave alone.
Long enough that your entry and exit costs are spread thin, which usually means weeks rather than days. The tables above show 30 days surrendering 38% of gross yield and 90 days surrendering 13%.
Yes, by pairing spot and perpetual positions in the same account. It removes transfer costs entirely, which is what makes smaller accounts viable.
No, but you do need current rates across venues at the moment you decide, and that is tedious by hand. Pocketfolio’s DIY Trading Scanner covers 50+ exchanges for the comparison step, and the Smart Yield Pool automates execution once you have picked a rate.
No, and you should not plan as if they do. Every annualised figure here assumes a rate stays put, which real funding rates do not, so use them to compare scenarios rather than to project income.
Maker taker fees come from Bybit’s own published schedule rather than third-party summaries. At VIP
0, spot trades at 0.10% for both maker and taker, and USDT perpetuals trade at 0.02% maker and
0.055% taker.
Summing the four fills in a round trip gives 0.24% on maker pricing. That figure independently matches
the 0.24% round trip other published analyses quote for the same venue, and the resulting 8-day break-
even at a 0.01% rate matches as well.
Binance and OKX publish their fee tables through scripts that could not be read directly, so no Binance
or OKX fee figure is stated as fact anywhere in this guide. Check your own venue’s live schedule before
sizing a position.
The funding rate table is a dated snapshot of nine venues taken on 22 September 2026, normalised to 8-
hour intervals. It was cross-checked against a second independent data source showing BTC 8-hour
funding at 0.0100% and 11.0% annualised on the same day, which matches the 10.95% this guide
calculates for that rate.
Withdrawal cost figures come from published reporting rather than exchange documentation, because
most venues quote withdrawal fees on the withdrawal screen instead of publishing a standing schedule.
Share this article
Share this article
Best Exchanges for Crypto Funding Rate Arbitrage
The best exchanges for crypto funding rate arbitrage are not
Is Crypto Funding Rate Arbitrage Still Profitable?
Is crypto funding rate arbitrage still profitable? In roughly a
Crypto Funding Rate Arbitrage in a Bear Market
Crypto funding rate arbitrage in a bear market does not
You may be interested in these blogs
Best Exchanges for Crypto Funding Rate Arbitrage
The best exchanges for crypto funding rate arbitrage are not the ones with the lowest fees or the deepest books.
Is Crypto Funding Rate Arbitrage Still Profitable?
Is crypto funding rate arbitrage still profitable? In roughly a tenth of the market, yes. In most of the rest
Crypto Funding Rate Arbitrage in a Bear Market
Crypto funding rate arbitrage in a bear market does not stop working. It gets smaller, and the version that replaces
Ready to Explore the Platform?
Explore AI-powered tools for analyzing arbitrage opportunities.
No fees. No risk. Cancel anytime.

Ready to Explore the Platform?
Explore AI-powered tools for analyzing arbitrage opportunities.
No fees. No risk. Cancel anytime.

New breakdowns on funding rates, arbitrage and market structure will arrive at your inbox.